Energy Addition, Not Transition: Fossil Fuels Remain the Bedrock of Progress
Like clockwork, we receive the annual Statistical Review of World Energy relevant to energy geopolitics every June. From 1954 until 2022, BP volunteered to compile this data. Initially, the review only covered oil, but was later expanded to include all fossil fuels, and finally to include data on renewable energies and nuclear energy. Since 2023, the Energy Institute has continued this essential work of analysing quantitative developments in energy geopolitics.
On 26 June 2025, the Energy Institute published the latest version containing data from 2024. It allows us to conclude that little has changed: the world continues to rely heavily on fossil fuels. Globally, the expansion of renewable energy sources is lagging behind rising energy demand, with fossil fuels accounting for a significant proportion of this growth. Rather than undergoing a definitive energy transition, the world is currently experiencing a phase of energy addition, where new renewables are supplementing rather than replacing conventional energy sources. But let’s look at that in more detail.
Fossil Fuels: The Unshakeable Foundation of Global Energy
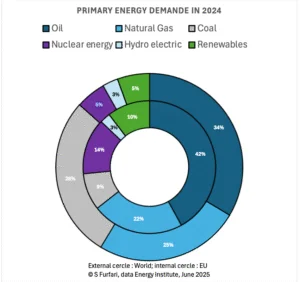
In 2024, the global energy supply increased by 2%, driven by rising demand for all types of energy. Non-OECD countries led this growth, accounting for the largest share and the most significant annual increases. Now that the 2024 data has been released by the Energy Institute, it is appropriate to update the widely cited figure of ‘about 80%’ for the share of fossil fuels in the global energy mix. In reality, fossil fuels remain the cornerstone of the global energy system, accounting for 86.6% of total energy consumption – 513 exajoule (EJ) out of 592 EJ in total. It is important to note that this proportion is considerably higher than the commonly cited estimate of 80%. In the EU, fossil fuels still represent 73.4%, despite the increase in renewable energy consumption. Nuclear energy delivered 31 EJ (5.2%), hydropower 16 EJ (2.7%), and wind and solar power, along with other renewables, 33 EJ (5.6%).
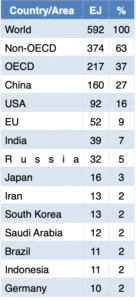
In terms of primary energy consumption, China is by far the largest consumer, accounting for more than a quarter of the total demand with 160 EJ. The EU’s consumption is one third of China’s, at 52 EJ. Notably, Germany is one of the countries with a consumption level greater than 10 EJ.
Table 1 Largest primary energy consumers, with the consumption of at least 10 EJ in 2024. Energy Institute data for 2025.
Global energy demand grew by 1.8% from 2023 to 2024. North America and the EU recorded the most modest increases in energy consumption, with growth rates of 0.4% and 0.3% respectively. In contrast, and sadly, Africa saw the smallest absolute rise in energy demand, with an increase of only 0.29 EJ – less than 40% of the EU’s incremental demand of 0.73 EJ. The Asia-Pacific region was the primary driver of global energy demand, accounting for 65% of the worldwide increase, and now representing 47% of total global energy consumption. China and India saw annual increases of 2.4% and 4.3%, respectively.
Figure 1 The share of primary fuels in the EU (inner circle) compared to the rest of the world (outer circle). Data from the Energy Institute for 2024.
In order to evaluate the effectiveness of energy transition policies, it is helpful to review developments over the past decade and compare the trajectory of the European Union with that of the rest of the world. This comparative approach enables us to ascertain whether the EU is truly spearheading the global transition or becoming increasingly isolated in its ambitions.
The EU’s Green Ambitions: Leadership or Illusion?
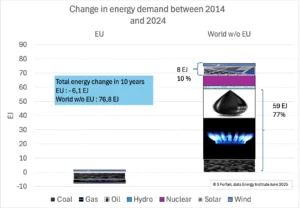
Over the past ten years, the EU has reduced its energy demand by 6.1 EJ. In contrast, the rest of the world has increased its energy demand by 76.8 EJ – thirteen times more. This is not surprising given that the EU’s competitiveness is currently under threat from the Green Deal. This tragedy is even recognised by the Mario Draghi report, although it does not directly attribute faults to the Green Deal in order to remain politically correct. Instead, the report blames the increase in energy prices, which are nevertheless the consequence of EU energy policy.
Outside the European Union, renewable energy sources such as wind and solar power have generated 8 EJ. This figure actually surpasses the change in energy demand within the EU itself. Nevertheless, over the past ten years, fossil fuel consumption has increased by 59 EJ. This means that outside the EU growth in fossil fuels has outpaced that of renewables by a factor of 7.3. In other words, while modern renewable energy is expanding, fossil fuel use is increasing at a rate more than seven times greater. Contrary to the commonly held belief within the EU that the gap between renewables and fossil fuels is narrowing, the reality is that the gap is widening.
The evidence suggests that the EU has indeed achieved results in the energy transition, undergoing a profound transformation of its electricity sector and setting benchmarks for renewable energy integration and emissions reduction. However, the EU’s progress is not being matched elsewhere, and its leadership is merely symbolic because the rest of the world is accelerating its use of fossil fuels more than its use of renewable energy. When a leader realises that no one is following them, they must reconsider whether they are truly leading.
Figure 2 Ten years of evolution in primary energy demand in the EU and the rest of the world. (Energy Institute data for 2014 and 2024)
In 2024, total oil and condensate consumption reached an all-time high of 105 million barrels per day, marking a 0.8% increase. Over a ten-year period, oil consumption grew by 1.1%. Even in the EU, total oil consumption increased by 0.2% in 2024 compared to 2023, reaching 11 million barrels per day. According to the Energy Institute, the United States is the world’s top oil producer. In 2024, it achieved a daily crude oil and condensate output of 13,194 million barrels, marking a 2.0% increase compared to the previous year. This level of production accounted for 16% of the global total, underscoring the country’s significant role in the world oil market. Over the decade from 2014 to 2024, U.S. crude oil and condensate production expanded at an average annual rate of 4%, reflecting sustained growth and the ongoing dynamism of the USA energy sector. Last year, Russia and Saudi Arabia ranked second and third respectively for crude oil and condensate output.
Global natural gas consumption totalled 4,128 billion cubic metres in 2024, marking a 2.5% increase in 2023. OECD countries accounted for 43% of the total with 1,784 billion cubic metres, the EU for 7.8% with 323 billion cubic metres, and non-OECD countries for 56.8% with 2,344 billion cubic metres. The USA led the way with 902 billion cubic metres (22% of global consumption), followed by China with 434 billion cubic metres (10.5%). With an annual growth of 2% over the last ten years, natural gas appears to be the preferred global fuel.
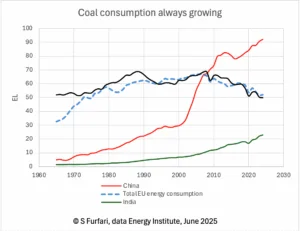
Contrary to the narrative often presented by the media, coal production has increased, rising from 165 EJ in 2014 to 182 EJ in 2024. While natural gas production is increasing everywhere, coal consumption patterns are strikingly different: 83% of coal is consumed in the Asia-Pacific region, with China accounting for 56% of this. Together, China, India and Indonesia produce 130 EJ, i.e. 71% of global coal production.
With coal consumption at 92 EJ, China’s consumption is 1.7 times greater than the EU’s total primary energy demand. Although China’s coal consumption decreased during the pandemic, it has since recovered, whereas the EU has continued to reduce its total energy consumption.
This should not be overlooked when the EU claims to want to lead the way in the global energy transition. The contrast between the EU’s green narrative and the reality of global energy demand is significant, not only in China.
Figure 3 Evolution of coal consumption in China and India compared with the EU’s total primary energy consumption.
Emissions Divide: Global Realities vs. Climate Aspirations
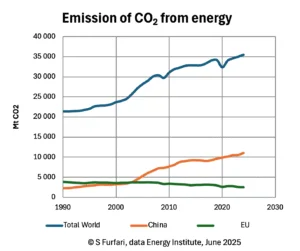
These trends directly impact carbon dioxide emissions. In 2024, global energy-related emissions reached 35,492 million tonnes of CO₂ equivalent. OECD countries were responsible for 11,072 million tonnes of this amount, while non-OECD countries accounted for an unprecedented 68.8% of global emissions, or 24,420 million tonnes. China was the single largest emitter, generating 11,173 million tonnes of CO₂ equivalent – representing 31.5% of the global total. The United States contributed 13.0%, while the European Union was responsible for 7.0% with 2,484 million tonnes. Once again, the willingness to drive worldwide climate change policy is failing. Outside the Brussels – Strasbourg fora, the interests of national leaders lie in prosperity rather than the utopian goal of reducing CO₂ emissions. Even if the EU continued to degrowth, voluntarily or involuntarily, this would not change the growth dynamics of global CO₂ emissions.
This is also demonstrated by the fact that global CO₂ emissions from energy growth increased substantially by 65% between 1990 – the decade before the UN adopted the UN Framework Convention on Climate Change in 1992 – and 2024. While the EU reduced its emissions by 30% (from 3,628 to 2,483 MtCO₂, i.e. 1,145 MtCO₂), China’s emissions reached 11,173 Mt, i.e. a 373% increase compared to 1990. The country with the highest percentage increase is Vietnam at 1,758%. Indonesia’s emissions have increased by 446% due to its extensive use of coal, as previously mentioned. Thanks to the abundance and low price of shale gas, the USA has reduced its coal combustion and emissions by 8%. Therefore, it is not an exaggeration to claim that the EU has spent billions on a minor reduction, which has been completely offset by China’s emissions alone, not to mention those of the rest of the world.
Figure 4 CO₂ emissions from energy use. EI, data for 2024
Meanwhile, the increase in global electricity demand continues to outpace overall energy demand growth. Notable increases in electricity consumption were experienced in every region, with the Asia-Pacific and Middle East regions leading the way with growth rates in electricity generation of 5.4% and 5.3%, respectively. Over the past decade, global electricity generation has grown substantially, rising from 24,073 terawatt-hours (TWh) from 2014 to 31,256 TWh in 2024. This represents an increase of 7,183 TWh, or 30%. China stands out as the world’s leading producer, generating 10,087 TWh in 2024 and accounting for 32% of global electricity output.
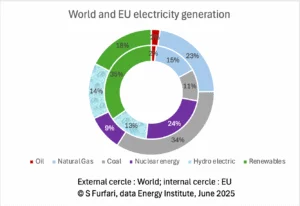
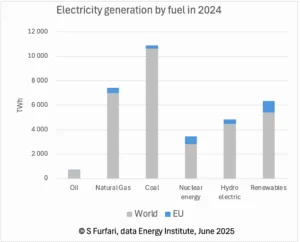
The European Union’s electricity generation mix differs markedly from the global average. Globally, coal remains the dominant fuel for electricity production, accounting for over a third of total generation. In contrast, within the EU, renewable sources – primarily wind and solar – constitute over one third of the electricity mix, surpassing coal by a significant margin. Nuclear energy also plays a more prominent role in the EU than globally. While nuclear power contributes less than 10% of global electricity generation, it accounts for around a quarter of the EU’s electricity supply. Furthermore, natural gas accounts for just 15% of electricity generation in the EU, whereas it constitutes nearly a quarter of the global total. These differences highlight the distinctive composition of the EU’s energy portfolio, reflecting policy choices and regional resource availability.
Figure 5 Fuel mix for the electricity generation in the world and in the EU. Data from EI 2025.
Figure 6 The EU’s share of electricity with energy sources. Data from EI 2025.
Figure 6 shows that the European Union’s share of global electricity generation remains relatively low across all types of energy sources. While the EU’s contribution is somewhat higher in the case of nuclear and renewable energy sources, this difference is not substantial. Consequently, it is unlikely that electricity generation within the EU will serve as a model for future global developments, regardless of the energy source.
The global renewable energy supply grew by 8%, with China contributing more to this expansion than all other countries combined and being responsible for 58% of the total increase.
Addition but not transition
We did not report on the data of others in many instances in the 2025 Statistical Review of World Energy because we just wanted to emphasise the geopolitical discrepancy between the results of EU energy policy and those in the global world. Despite widespread discourse about an energy transition (the EU EnergieWende), we saw that fossil fuels continue to be the cornerstone of the global energy system. In 2024, they accounted for 87% of total global energy consumption – 10% higher than the commonly cited figure of 80%. This dominance persists even as renewable energy sources, mainly intermittent and variable wind and solar, expand. This indicates that the world is experiencing a phase of ‘energy addition’ rather than a true transition – renewables are supplementing, not replacing, fossil fuels.
Renewable energy sources are growing rapidly in absolute terms. In 2024, wind, solar and other renewables contributed 33 EJ (5.6%) to the global energy mix, while hydroelectricity contributed 16 EJ (2.7%). However, the growth in renewables is not keeping pace with rising global energy demand. Over the past decade, fossil fuel consumption increased by 59 EJ, outpacing the growth of renewables by a factor of 7.3.
Non-OECD countries, particularly those in the Asia-Pacific region, are the main drivers of growth in the global energy demand. In 2024, the region accounted for 65% of the worldwide increase in energy demand, and currently represents 47% of total global energy consumption. China is the single largest energy consumer, responsible for over a quarter of global demand and 56% of global coal consumption. By contrast, OECD countries, including the EU and North America, have experienced only modest growth in energy demand.
While the European Union has made progress in reducing its energy demand, this is not solely due to energy efficiency, but also to ongoing deindustrialisation and a continuous lack of competitiveness. Renewables now constitute over one third of the EU’s electricity generation and nuclear energy accounts for around 25% – both figures are much higher than the global averages. Integrating renewables and nuclear energy into the electricity mix is a step towards decarbonisation, but this comes with an increase in energy prices, which negatively impacts prosperity and progress for citizens and industry. However, these achievements are largely symbolic on the global stage, as the rest of the world continues to increase its consumption of fossil fuels at a much faster rate. The EU’s share of the global energy and electricity generation remains relatively low, which limits its influence on global trends.
In 2024, global energy-related CO₂ emissions reached 35,492 million tonnes, with non-OECD countries accounting for almost 70% of this figure. China alone accounted for a third of the global total. Although the EU has reduced its emissions by 30% since 1990, this progress has been overshadowed by the substantial increases in emissions observed in China, India, and other developing economies.
The report highlights the stark contrast between the EU’s ambitious energy transition policies and the global reality. While the EU’s Green Deal and related policies have transformed its energy sector, they have also raised energy prices and, as stated in the Mario Draghi report, jeopardised competitiveness. Outside the EU, energy policy is primarily driven by economic growth and energy security, with less emphasis on reducing emissions. This divergence highlights the limited global impact of the EU’s energy transition and the difficulty of achieving significant global reductions in emissions.
Rather than undergoing a global EnergieWende, the world is currently in a phase of energy addition, whereby new energy sources are simply added to existing ones rather than replacing them. Given that the vast majority of the world’s population aspires to greater prosperity and an improved quality of life – and therefore cheap, abundant energy as desired by the EU before its conversion to ecologism – it is highly unlikely that these trends will be reversed. Economic and social imperatives, as well as the need for secure energy supplies, make a reduction of fossil fuels demand improbable.
As a result, the gap between climate ambitions and the reality of global energy consumption will only widen further. Failure to meet the announced climate targets is now so obvious that it is reasonable to anticipate a possible abandonment of the Paris Agreement, as it will become increasingly difficult to conceal the scale of this failure. Paradoxically, while the latest edition of the Statistical Review of World Energy clearly demonstrates this failure, the European Commission continues to propose utopian targets, such as a 90% reduction in its own emissions by 2040.
Bottom line: what we’re seeing is not a replacement, but an expansion—with fossil fuels still at the core.

Samuel Furfari
Samuel Furfari is an engineer, and PhD from University of Brussels. He is a Professor of energy geopolitics and policy. For 36 years he was a senior official in the European Commission’s Directorate-General for Energy. He is author of numerous books.
more news
Ed Miliband is the last fool standing on Net Zero
As the United States moves to reconsider key climate regulations, Britain’s aggressive push toward Net Zero is drawing increasing scrutiny. In this commentary, Matt Ridley argues that unilateral decarbonisation risks leaving the UK economically isolated while much of the world shifts course.
Climate change computer projections are manifestly false and dangerously misleading
The alleged threat to the planet from human caused climate change has been at the forefront of Australian politics over the recent half century. Every year, just before meetings of the UN Conference of the Parties (COP) to the Climate Change Convention, slight increases in atmospheric carbon dioxide and global temperature are portrayed in the media as harbingers of future doom. Every extreme weather event is made out to be an ill omen of what is to come unless fossil fuels are eliminated.
Glacier fluctuations don’t yet support recent anthropogenic warming
Holocene glacier records show that glaciers worldwide reached their greatest extent during the Little Ice Age and were generally smaller during earlier warm periods. While glacier length is a valuable long-term regional climate indicator, the evidence does not clearly support the idea of uniform, synchronous global warming.
