Why the modern CO₂ spike looks scarier than it is
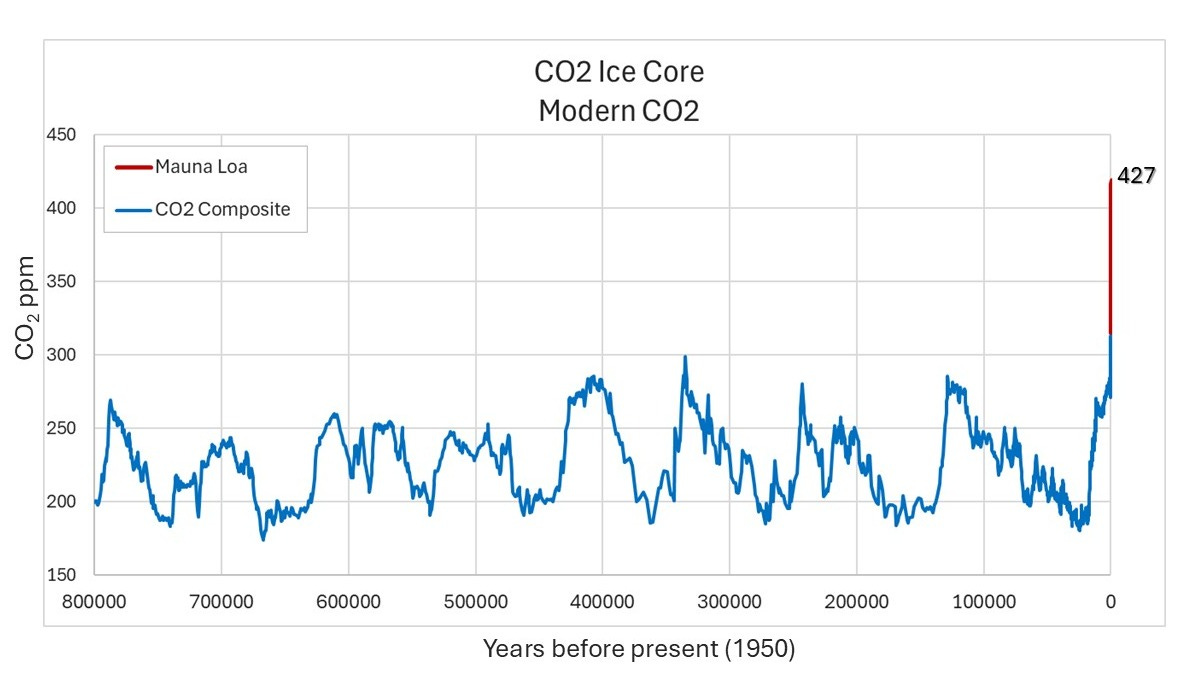
Modern CO₂ levels often appear dramatic when recent instrumental measurements are directly compared with long-term ice core records. However, paleo-CO₂ proxies smooth atmospheric signals over centuries, which dampens rapid changes. When modern CO₂ data are smoothed to match proxy resolution, today’s levels still exceed past interglacial peaks but appear far less extreme than the raw measurements suggest.
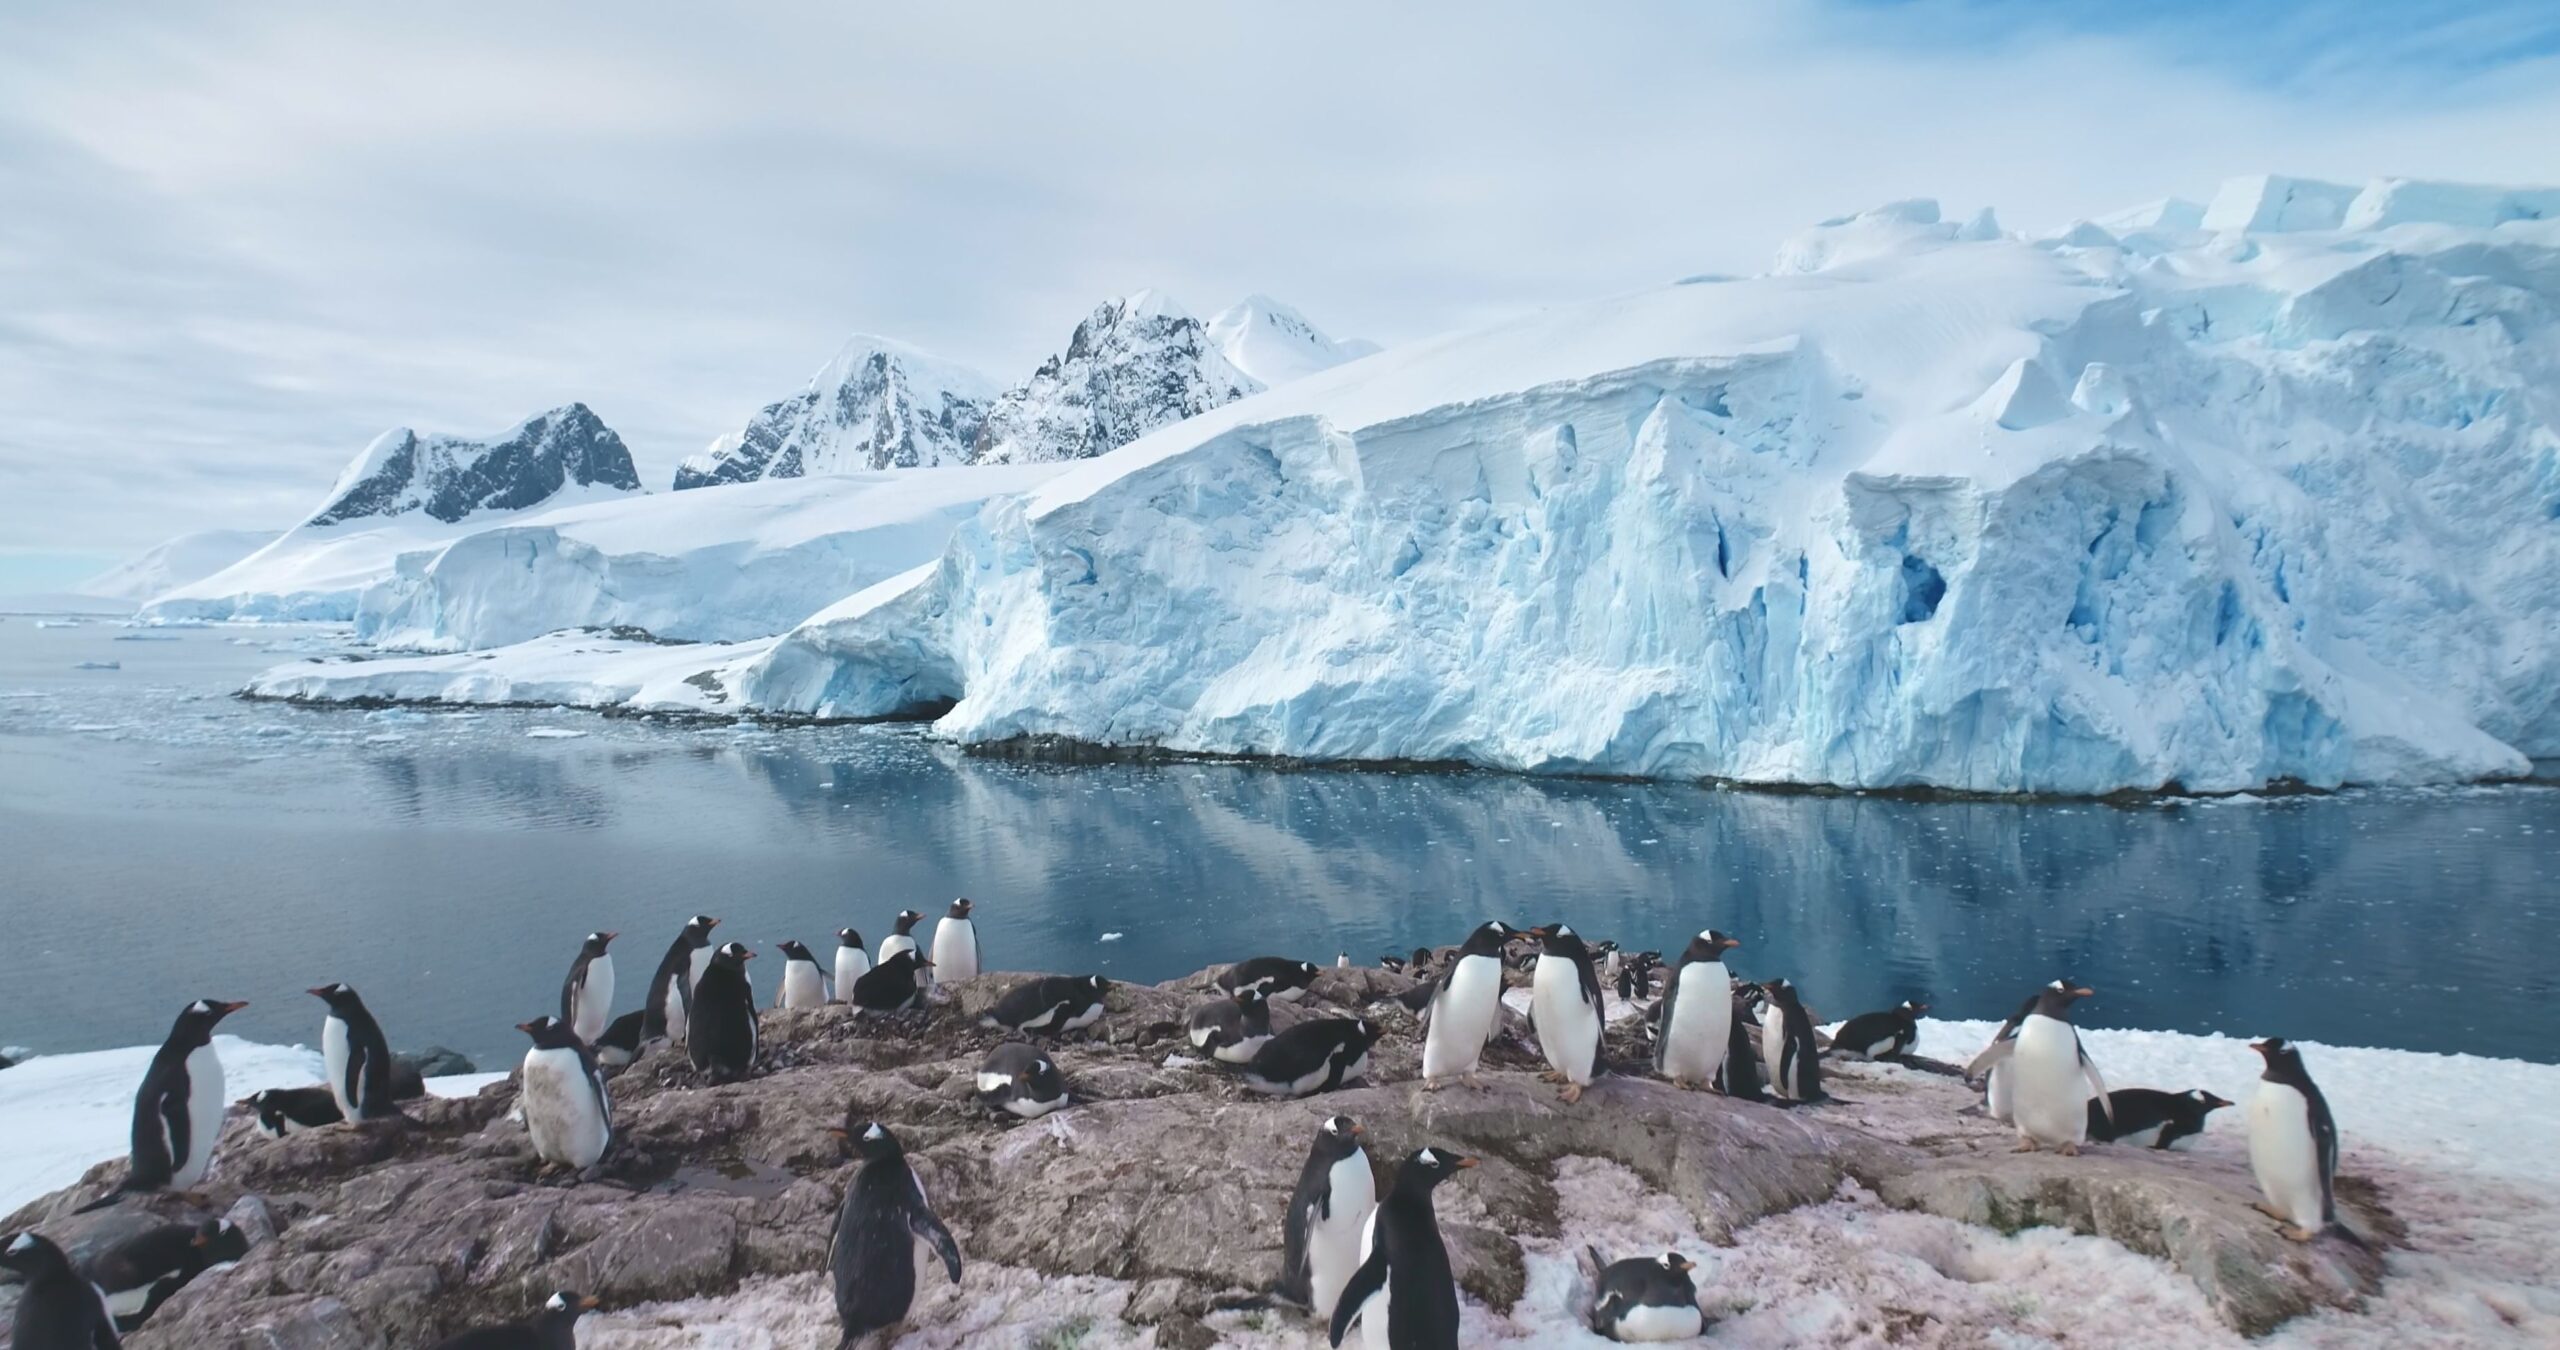
Antarctic ice cores remain the gold standard for reconstructing atmospheric CO₂ concentration (Source: Shutterstock)
Renee Hannon
Date: 10 March 2026
In this series, we’ve discussed how paleo-CO₂ proxies contain uncertainties and, more importantly, temporal smoothing. So before comparing modern CO₂ to the past, we need to view it through the lens of proxy smoothing.
We often see graphs of past CO₂ concentrations from ice cores simply sliced onto modern instrumental measurements. The modern spike looks dramatic, even alarming. But is that a fair comparison?
Paleo-CO₂ Uncertainty
Antarctic ice cores remain the gold standard for reconstructing atmospheric CO₂ concentrations over the past 800,000 years. Boron isotopes (δ¹¹B) in planktonic foraminifera also provide robust estimates of past CO₂ through their relationship with seawater pH. Both methods, however, have limitations.
For ice cores, analytical precision is excellent — typically around ±1 ppm. Inter-core offsets of 3–10 ppm occur (for example, WAIS Divide vs. Law Dome), likely due to subtle in-situ effects or extraction differences. In the context of a 170–300 ppm glacial-interglacial range, that represents at most 3% relative uncertainty. But analytical precision is not the main issue.
The dominant limitation is temporal resolution. Temporal resolution is a key issue for older ice cores and boron isotopes due to averaging or smoothing of atmospheric equivalent CO₂ over 100 to 300+ years.
Firn Smoothing is a Big Deal
At low accumulation Antarctic sites, which provide the deepest and longest records, gas age distributions typically smooth atmospheric CO₂ over ~100 to 300+ years (Kohler, 2011; Nehrbass-Ahles, 2020).
This smoothing is not a simple moving average. For firn smoothing, the gas age distributions are modeled with asymmetric filters like log-normal functions. These filters are derived from physical firn models and are backward-oriented, with variable weighting and more emphasis on relatively recent air but with a tail incorporating older mixed air.
Boron Isotopes: Lower Resolution with Age
The boron isotope proxy from fossil shells records ancient seawater pH, which is tightly linked to atmospheric CO₂ via ocean chemistry (de la Vega, 2023). Boron faithfully captures the glacial–interglacial CO₂ cycles across the past 400,000 years. Analytical and calibration uncertainties translate roughly to 10-20 ppm at lower CO₂ glacial values and 15-30 ppm at higher interglacial values.
Temporal resolution depends on sedimentation rate and bioturbation. Temporal resolution is 300 years at best during the Holocene and up to 1000 years in older deeper sediments. As sedimentation rates are lower with age, resolution decreases and bioturbation smooths the signals.
Matching the Past Records: Muted Modern CO₂ (MMCO₂)
The Mauna Loa CO₂ record, starting in 1958, provides direct measurements of atmospheric CO₂ for only the past 67 years. During this time, CO₂ rose annually from 315 ppm to 427 ppm.
For earlier years, CO₂ values are from high-resolution ice core records primarily Law Dome firn and ice, which has excellent temporal resolution due to high snow accumulation. These records show CO₂ rising slowly from ~305 ppm around 1925 to ~315 ppm by 1958 and overlap well with Mauna Loa records.
To simulate how modern CO₂ would appear in a low-resolution Antarctic ice core, 100-300 year backward smoothing filters (moving average and log-normal) were applied to the combined Law Dome and Mauna Loa data (Figure 2).
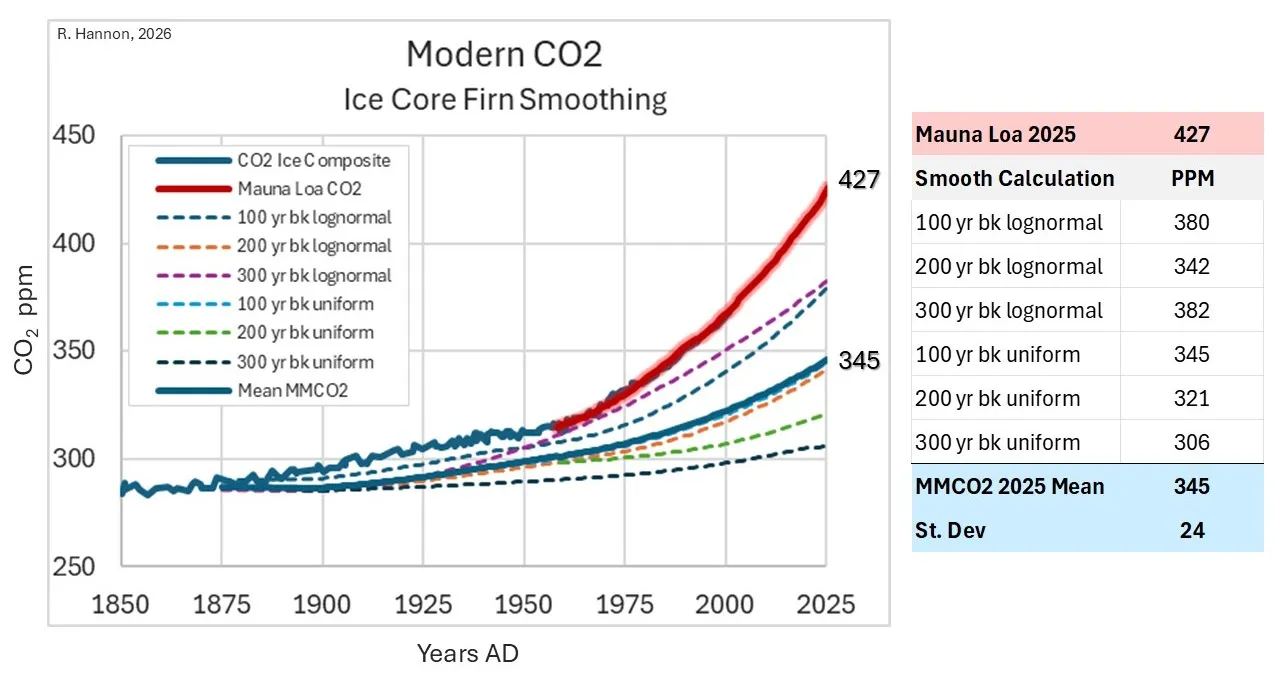
These “suppressed” curves illustrate how dramatically firn diffusion would dampen today’s rapid rise if it were recorded in low-accumulation Antarctic ice cores. Averaged computations show the mean Muted Modern CO₂ (MMCO₂) value for 2025 is 345 ppm +24 ppm compared to the Mauna Loa annual record of 427 ppm.
The Last Time CO₂ was This High
The smooth or muted modern CO₂ (~345 ppm) can now be compared to key paleo records from ice cores and boron with similar resolution over the past 3 million years (figure 3).
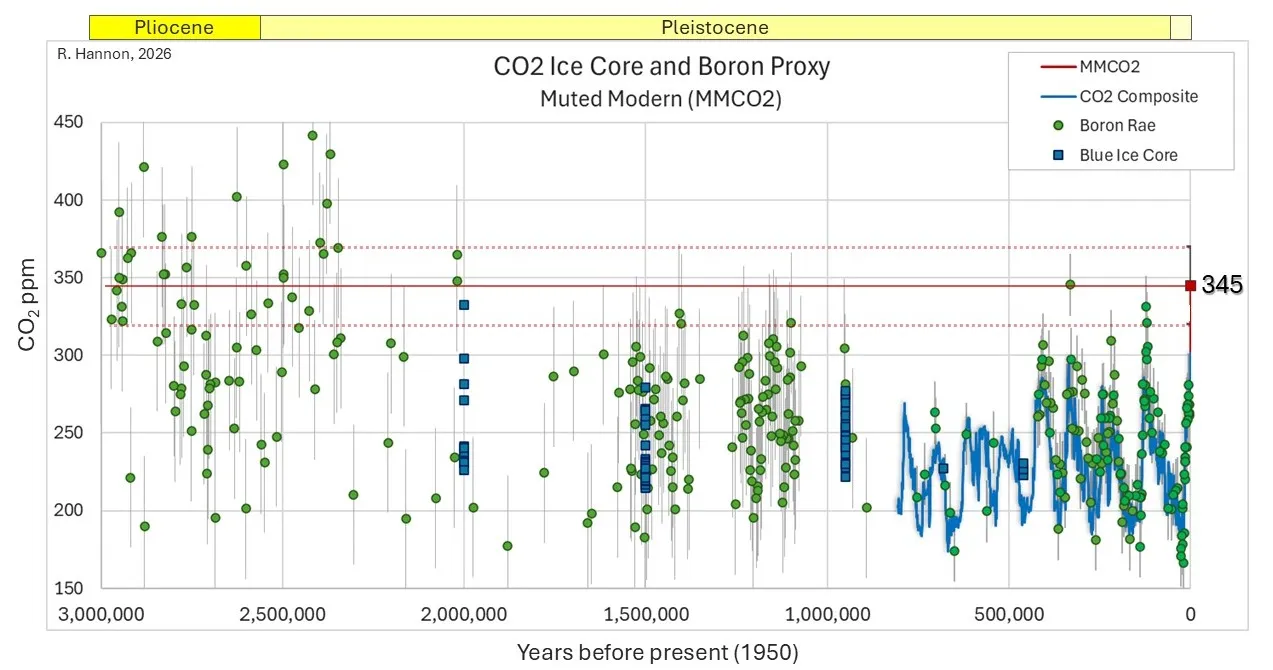
Key observations emerge:
- Ice core maxima over the past 800,000 years peak near 300 ppm, below the MMCO₂ of 345 ppm. Even the lower end of the smoothed range (~320 ppm) exceeds the interglacial peaks.
- Some boron isotope reconstructions approach MMCO₂ values during MIS 5 (~122,000 years) and MIS 9 (~330,000 years), though uncertainties are larger.
- Early Pleistocene (~1.1 and 1.4 my) boron estimates approach the MMCO₂ mean value and occasionally exceed the lower end.
- Around 2.0 my, boron isotopes approach and exceed the MMCO₂ values. Additionally, blue ice values are close to the MMCO₂ mean (332 ppm vs 345 ppm).
Thus, on a 100 to 300-year resolution basis, modern CO₂ is likely higher than at any time in the past 800,000 years, and possibly higher than most of the past 2 million years – even after accounting for smoothing.
But it is also true that the smoothed value (~345 ppm) lies much closer to past interglacial highs than the raw 427 ppm record suggests.
Both statements can be true.
Wrap-Up
The smoothed CO₂ value of ~345 ppm starkly contrasts with today’s unsmoothed levels of 427 ppm, demonstrating how firn diffusion in ice cores would heavily dampen the modern CO₂ rise. When fairly compared at proxy resolution, modern CO₂ is only slightly higher than past interglacial peaks and lies within the uncertainty range over the past 1-2 million years.
Modern comparisons to paleo records should respect the physics and resolution limits of the proxy archives.
References
Bereiter et al., (2015). Revision of the EPICA Dome C CO₂ record from 800 to 600 kyr before present, Geophysical Research Letters 42:542-549, doi: 10.1002/2014GL061957.
https://www.ncei.noaa.gov/pub/data/paleo/icecore/antarctica/antarctica2015CO₂ .xls
de la Vega, E., Chalk, T. B., et al. (2023). Orbital CO₂ reconstruction using boron isotopes during the late Pleistocene, an assessment of accuracy, Clim. Past, 19, 2493–2510, https://doi.org/10.5194/cp-19-2493-2023.
Rae. J. W., et al. (2021). Atmospheric CO₂ over the Past 66 Million Years from Marine Archives. Annual Review Earth and Planetary Sciences. 49:609-641. https://doi.org/10.1146/annurev-earth-082420-063026.
Yan, Y., Bender, et al. (2019). Two-million-year-old snapshots of atmospheric gases from Antarctic ice. Nature, 574(7780), 663–666. https://doi.org/10.1038/s41586-019-1692-3.
Nehrbass-Ahles, C., Shin, et al. (2020). Abrupt CO₂ release to the atmosphere under glacial and early interglacial climate conditions. Science 369(6506), 1000–1005.
Köhler, P., Knorr, G., Buiron, D., Lourantou, A., and Chappellaz, J. (2011). Abrupt rise in atmospheric CO₂ at the onset of the Bølling/Allerød: in-situ ice core data versus true atmospheric signals, Clim. Past, 7, 473–486, https://doi.org/10.5194/cp-7-473-2011.

more news

Guardian Claims We’re Still Only Approaching the Climate Point of No Return
The Guardian claims the world is edging toward a climate “point of no return,” where unstoppable warming will lock Earth into a catastrophic “hothouse” future. Yet the geological record tells a very different story. Past periods of far higher temperatures and CO₂ levels did not end life or civilization’s prospects — they supported abundance and evolutionary expansion.

The EV experiment has become a bloodbath — $140 billion wasted — more to come
The electric vehicle push was supposed to reshape the auto industry and accelerate the energy transition. Instead, mounting losses and collapsing share prices are raising serious questions about whether governments and manufacturers misread the market. What began as a bold industrial gamble is now looking, to some critics, like one of the most expensive policy experiments in recent automotive history.

Sacré bleu! Macron blames renewables for Spain’s blackouts, France drops renewables targets, expands nuclear
Europe’s energy debate is shifting. After Spain’s major blackout, even long-time advocates of aggressive renewable targets are questioning whether power systems can rely so heavily on wind and solar without sacrificing stability.

