Breaking: no acceleration in sea level rise detected worldwide
A new peer-reviewed study published in the Journal of Marine Science and Engineering challenges a key claim of climate science: that global sea level rise is accelerating. An analysis of more than 200 long-term tide gauge records shows no evidence of such acceleration, while IPCC models systematically overestimate local sea level rise.
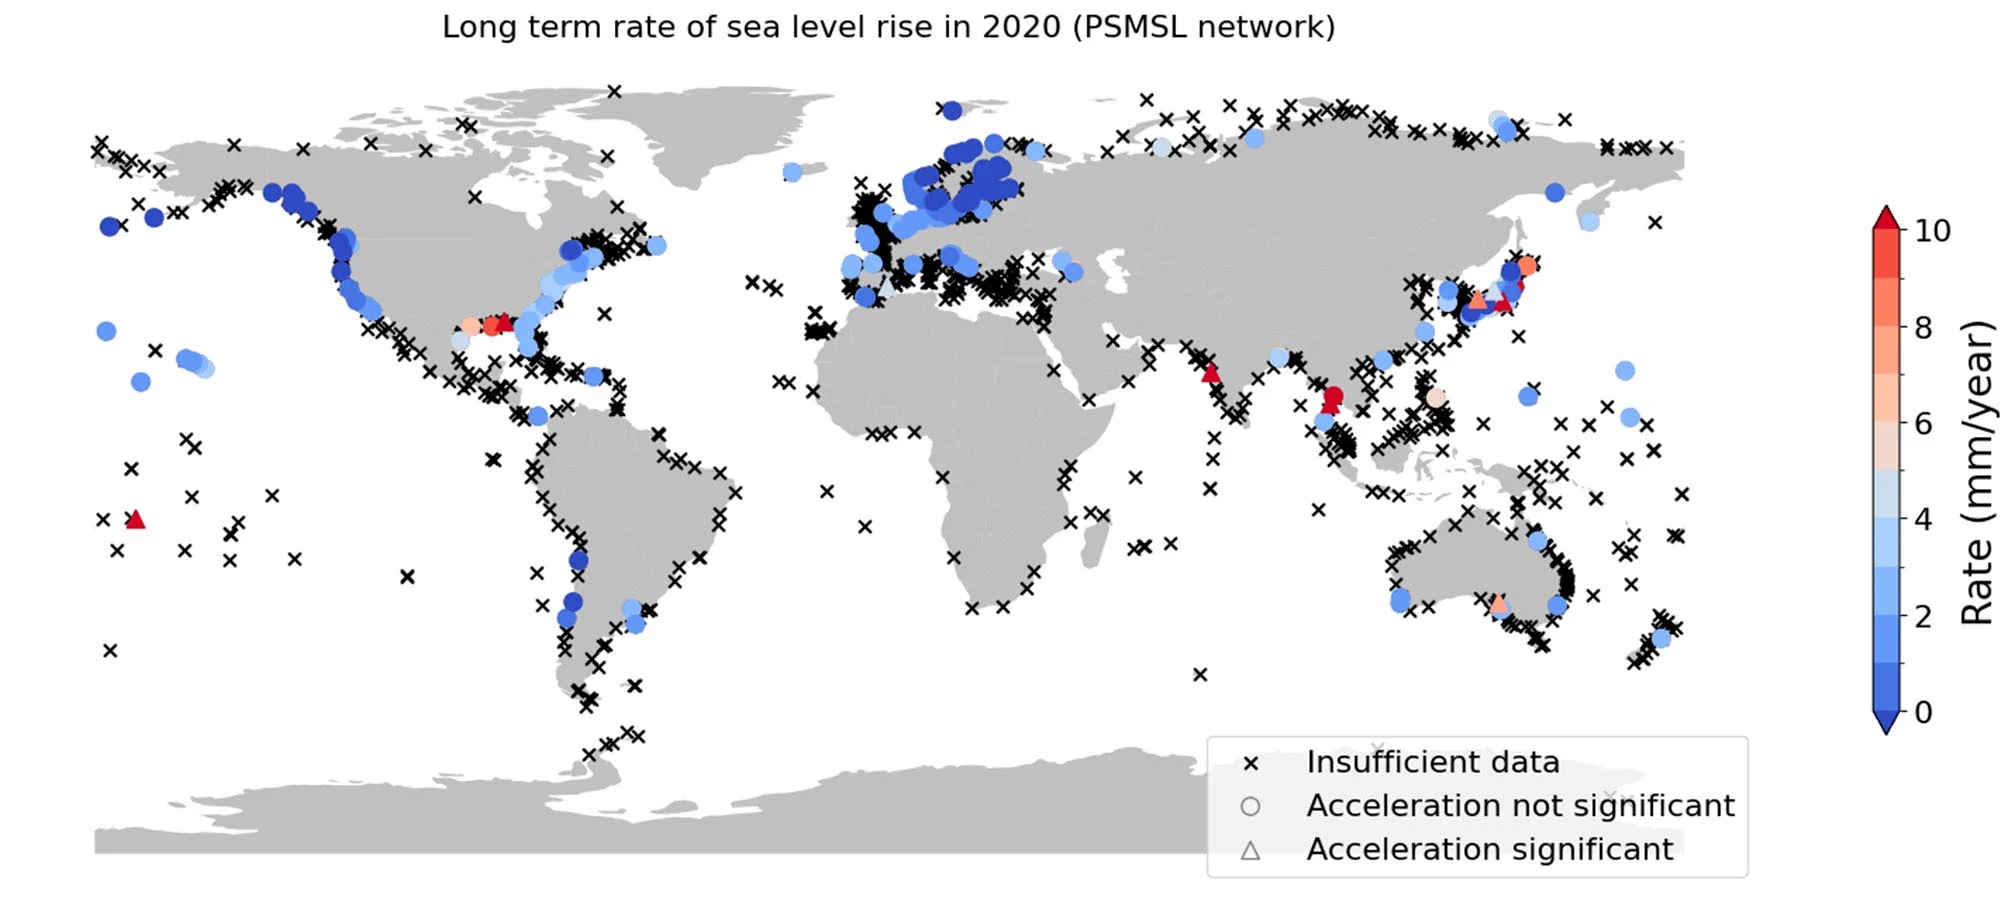
Image source: A Global Perspective on Local Sea Level Changes, Journal of Marine Science and Engineering,
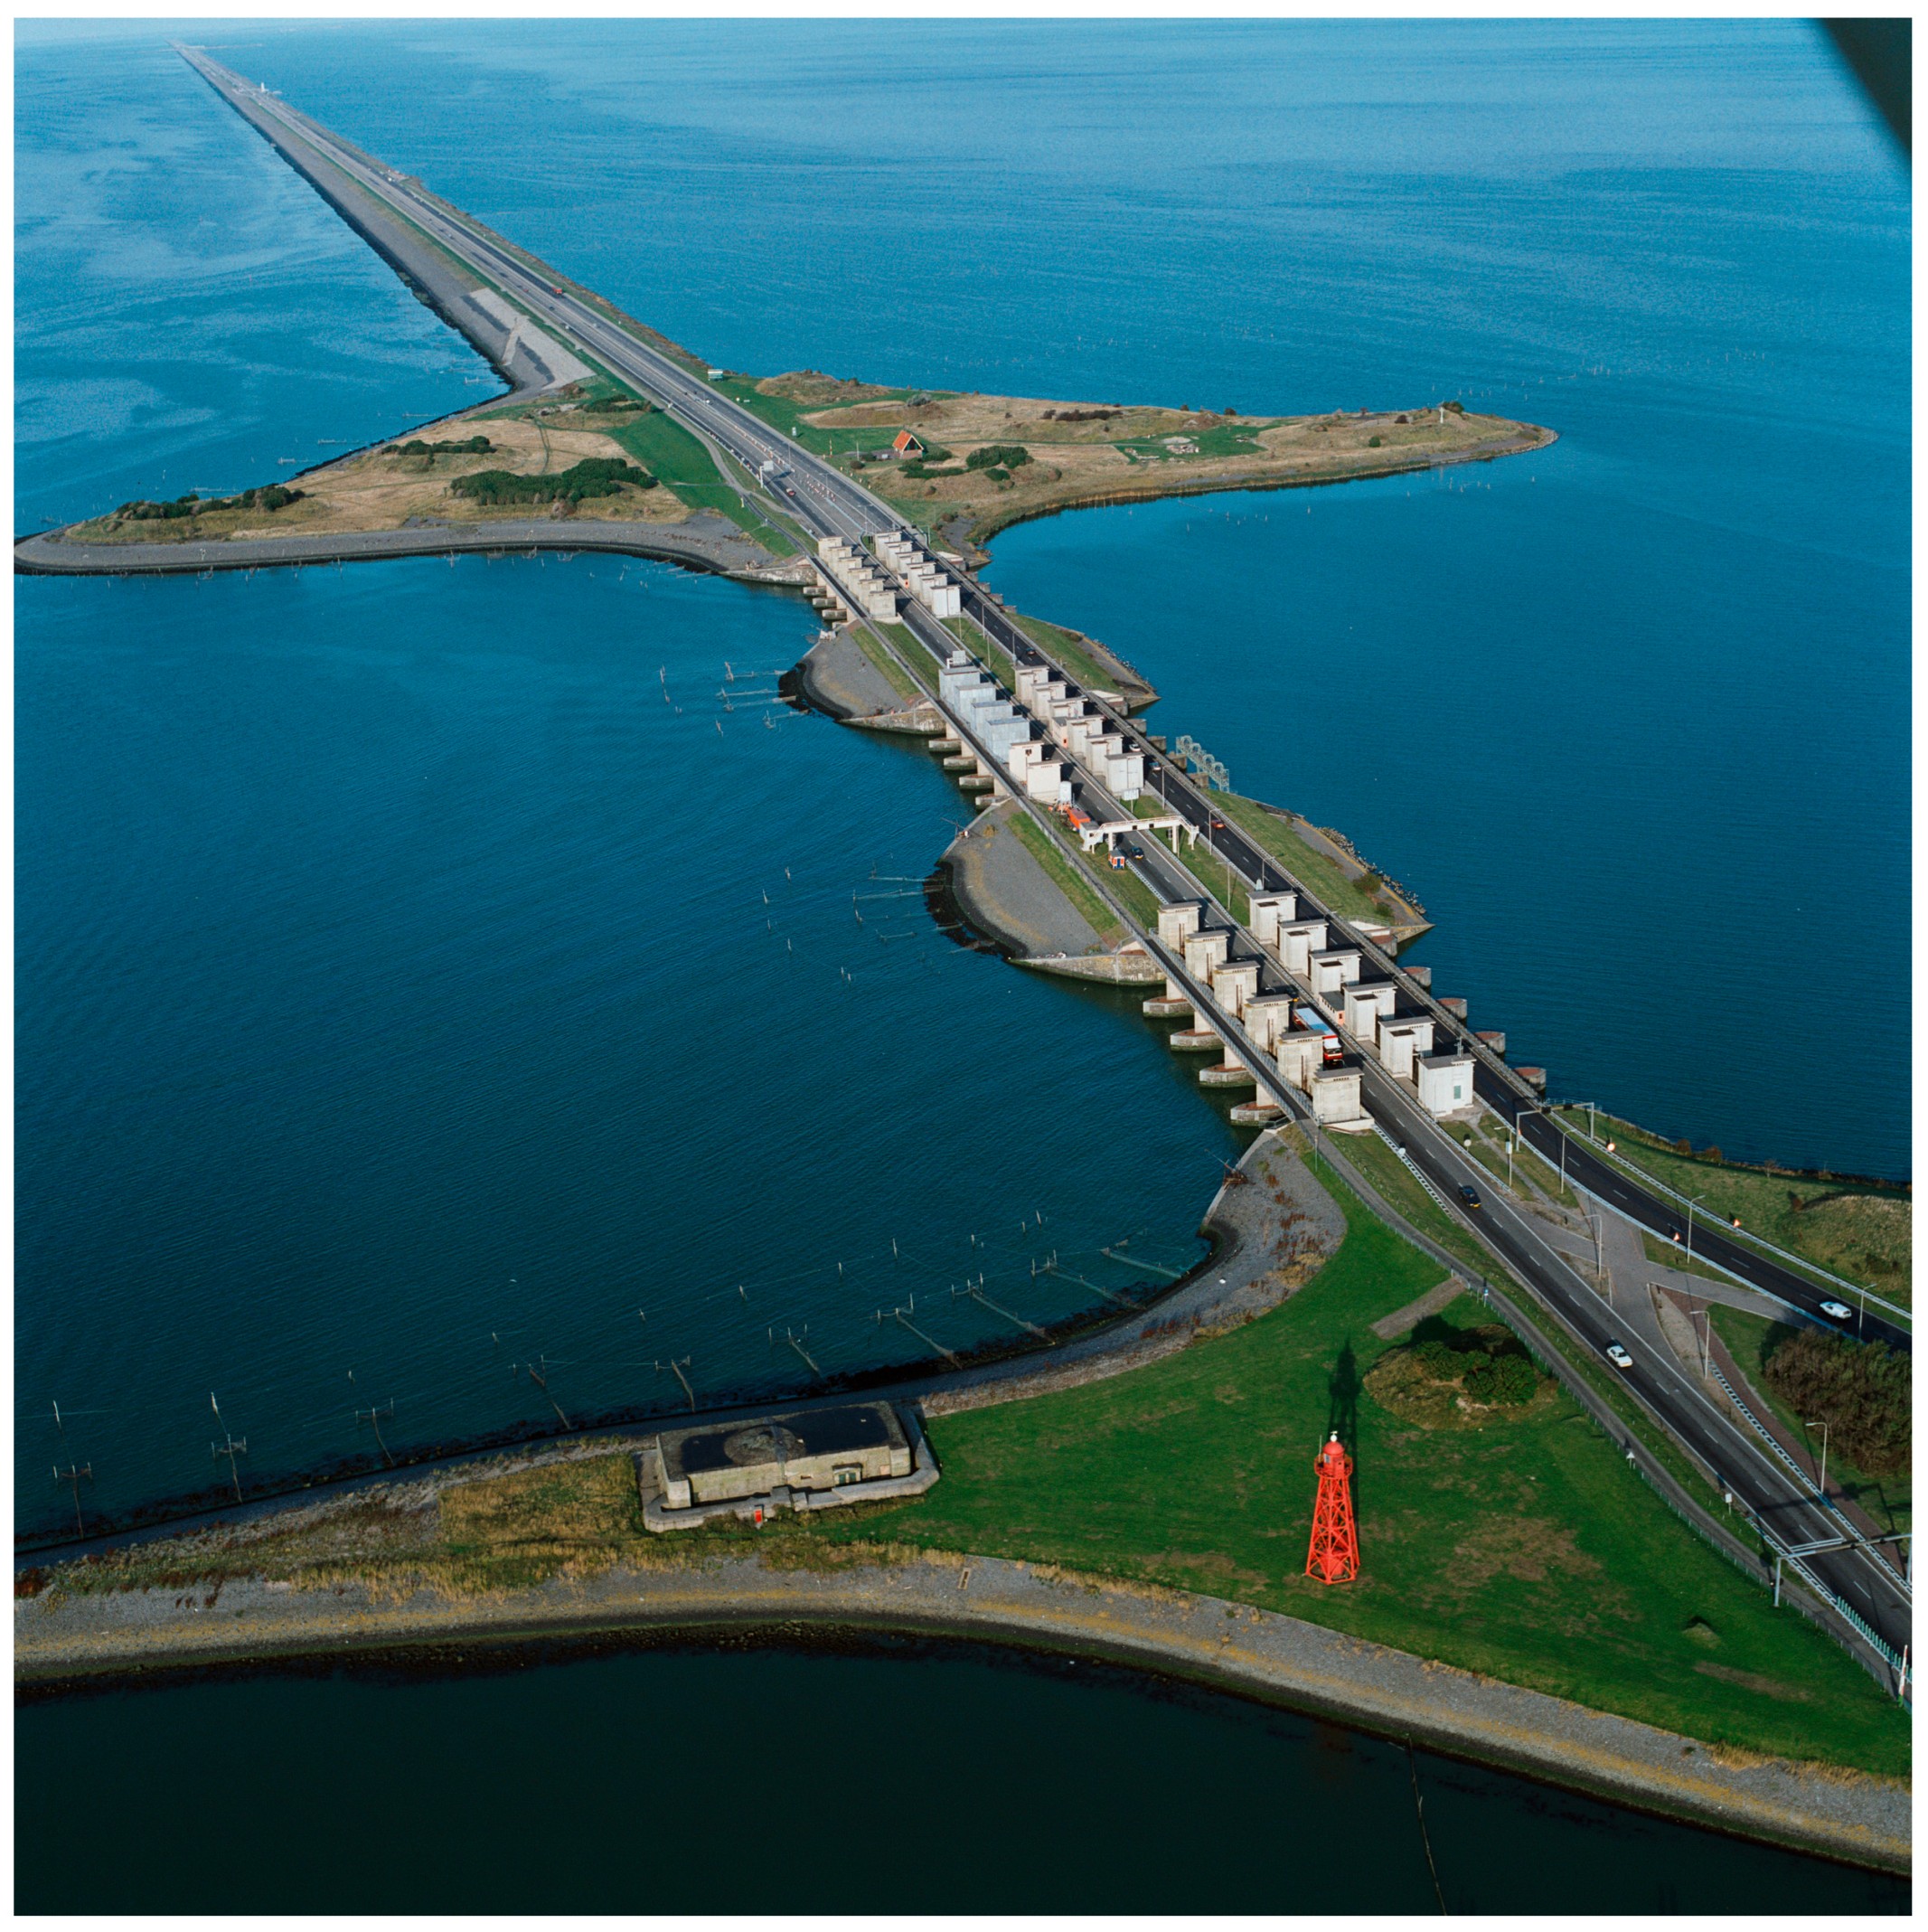
under CC BY 4.0. Image: Rijkswaterstaat image library.
Clintel Foundation
Date: 29 August 2025
An analysis of more than 200 tide stations around the world shows that there is no evidence of a global acceleration in sea level rise. That is the surprising conclusion of the paper A Global Perspective on Local Sea Level Changes, published this week in the Journal of Marine Science and Engineering. It is a unique study by two Dutch researchers, Hessel Voortman and Rob de Vos.
The paper also shows that IPCC models significantly overestimate local sea level rise in 2020. This new publication is a follow-up to an earlier paper from 2023 in which first author Hessel Voortman demonstrated that sea level rise along the Dutch coast was not accelerating.
These two paragraphs are the opening of a press release sent out on August 29 by engineer Hessel Voortman. Voortman spoke about his sea level research at the Clintel conference last year. Together with Rob de Vos (blogger at klimaatgek.nl), he has now published a scientific paper in which they demonstrate that sea levels are not rising at an accelerated rate worldwide. This is a spectacular result because climate scientists have been crying wolf about accelerating sea level rise in recent years. We will see whether this paper will receive as much media attention as the University of Utrecht modelling work earlier this week, which was used to make claims about the stagnation of the Atlantic Meridional Overturning Circulation (AMOC).
Below is the article that Rob de Vos wrote about the paper he and Voortman published.
The climate is a sensitive subject. Since the IPCC appropriated the subject of ‘climate change’, what was once a hypothesis now seems to be an unshakeable ‘fact’: the climate is changing, CO2 is the culprit, and humans are to blame. The fact that it is all a bit more complicated and that consensus (if it even exists) in science is meaningless are slowly gaining ground. This is difficult, because the opposing forces (one-sided scientific research, political pressure, constant one-sided reporting, etc.) are strong.
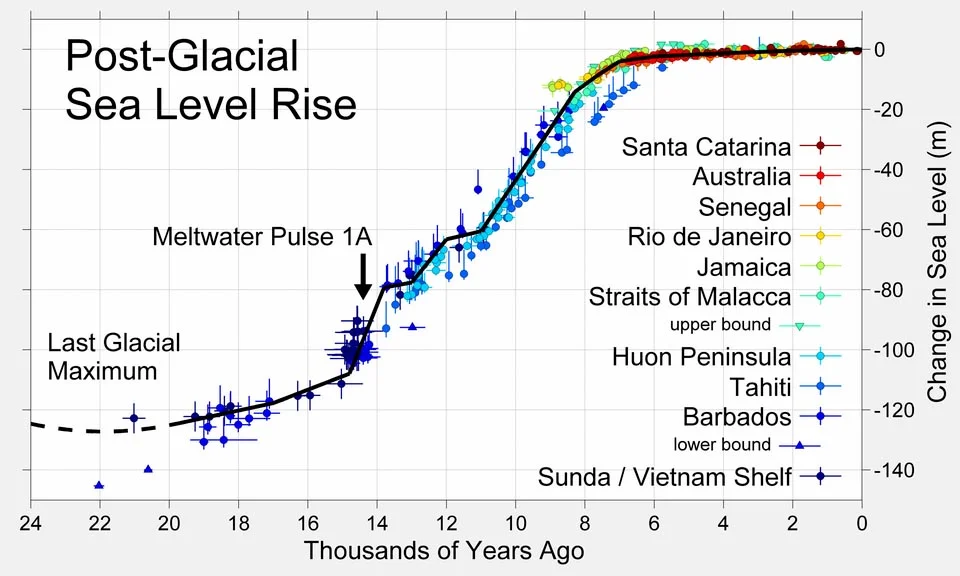
One of the ‘crown jewels’ of what I call the IPCC narrative, is rising sea levels. Now, rising sea levels are nothing unusual. Since the end of the last ice age (about 15,000 years ago), sea levels have risen by about 120 meters. It was not so long ago that ‘we’ could reach England on foot (across what is now the bottom of the North Sea). A thick coat was desirable, because at the end of the most recent ice age, the Weichselian glaciation, our region had a tundra climate.
Fig. 2 Source: Wikipedia
Rising temperatures from around 15,000 years ago caused ocean water levels to rise, initially rapidly and then more slowly, as shown in Figure 2. The graph is based on data from three publications by Fleming et al. 1998 and Milne et al. 2005. The main causes of this sea level rise were the melting of two ice caps in Scandinavia and North America and the expansion of ocean water as a result of warming.
In the modern era, sea levels are still rising, at an average rate of 1.7 ± 0.4 mm/year between 1901 and 2022 (Deltares). In recent years, there have been reports of an acceleration in sea level rise due to the enhanced greenhouse effect. In its latest report from 2021, the Intergovernmental Panel on Climate Change (IPCC) stated that sea levels have been rising at an increasing rate since 1900, in other words, that there has been a global acceleration in sea level rise.
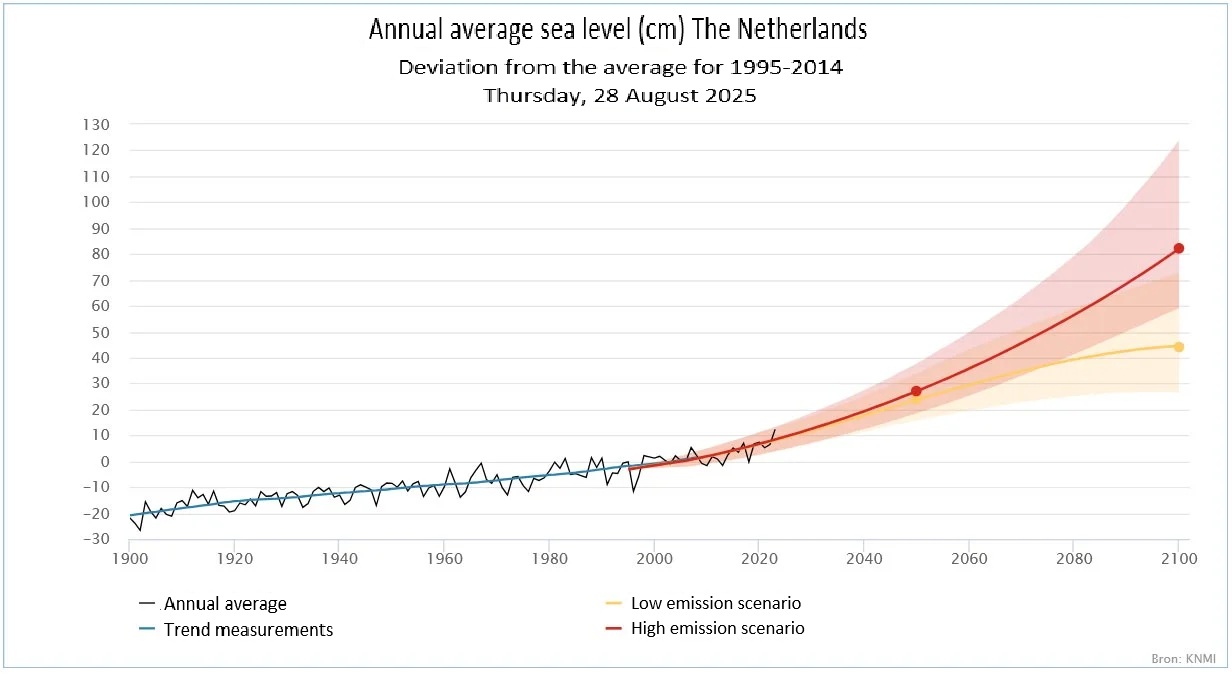
Fig. 3 Source: KNMI
Based on this, sea level models were developed that predicted fairly extreme sea levels for 2100. Figure 3 shows the forecast of KNMI for sea levels on the Dutch coast up to 2100. According to KNMI, these could rise with more than 120 cm by 2100 (relative to the 1995-2014 average). In an article from 2024, I calculated for the five Dutch coastal stations, that the relative sea level rise from 1900 to 2022 was 1.92 mm/year. If you subtract the average land subsidence along the coast from this, you arrive at an absolute sea level rise on the Dutch coast of 1.45 mm/year.
Figure 3 suggests that there is already an acceleration at the end of the measured (blue) series. Hessel Voortman demonstrated in an earlier publication from 2023 that this is incorrect. But what applies to Dutch tide stations does not necessarily apply to other stations worldwide. That is why Hessel Voortman and I decided to start a new study of tide stations worldwide. This resulted in a paper that was published this week:
Fig. 4 Source: MDPI
The study used sea level data from PSMSL, among other sources. Of the more than 1,500 stations, 204 remained that met the criteria. These criteria were: time series of at least 60 years, at least 80% of the data complete and continuous until at least 2015.
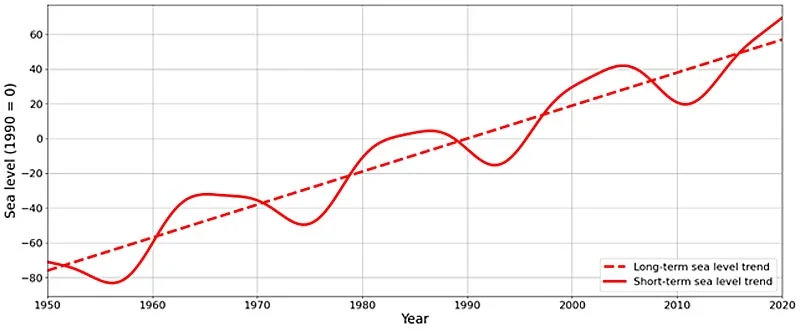
Fig. 5 Source: Voortman et al 2025
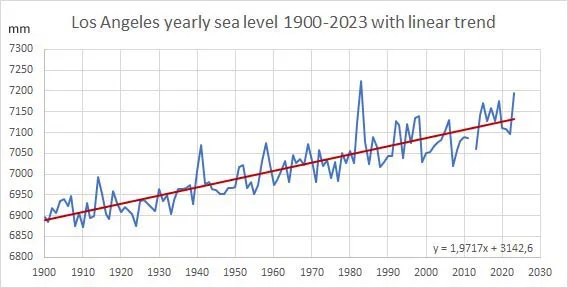
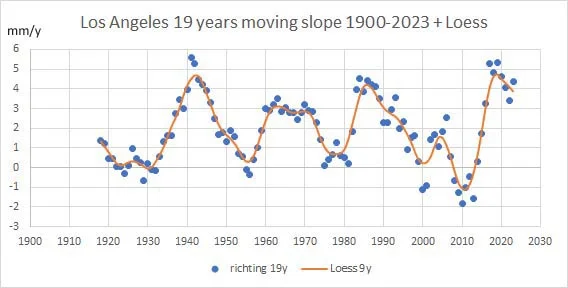
Figure 5 shows that this minimum series length of 60 years is important. The solid red wave line shows the fluctuation resulting from the nodal cycle of 18.61 years. If you measure a trend from a trough to a peak, there will always be a higher trend. However, other long-term fluctuations in the sea level trend also influence the trend, as I recently demonstrated in an article:
Fig. 6 Data: PSMSL
Fig. 7 Source: Klimaatgek
The blue dots represent the rolling 19-year trend, i.e. the trend from 1900-1918, 1901-1919, etc., up to 2005-2023. The graph clearly shows that the use of long-term tidal series is absolutely essential.
Of the more than 1,500 tide stations in the PSMSL database, 204 stations remained due to the criteria used. For these time series, we used a statistical test to determine whether a quadratic line (i.e. with acceleration) better describes the measurements than a straight line (no acceleration). For the vast majority of stations (195 to be precise), the difference between the quadratic and linear lines was not significant. For 195 stations, acceleration is not statistically demonstrable.
Fig. 8 Source: Voortman et al 2025
Twenty-four stations showed an abnormal pattern, with nine stations showing acceleration and the remaining 15 stations showing a remarkably steep slope without acceleration. In the latter category, GIA and short-term local rise were the main causes. GIA (Glacial Isostatic Adjustment) is the long-term process whereby the Earth’s crust and mantle seek a new equilibrium in response to the reduced mass of melted ice caps from the last ice age. This search for a new equilibrium means that the Earth’s surface rises, thereby influencing local tidal measurements.
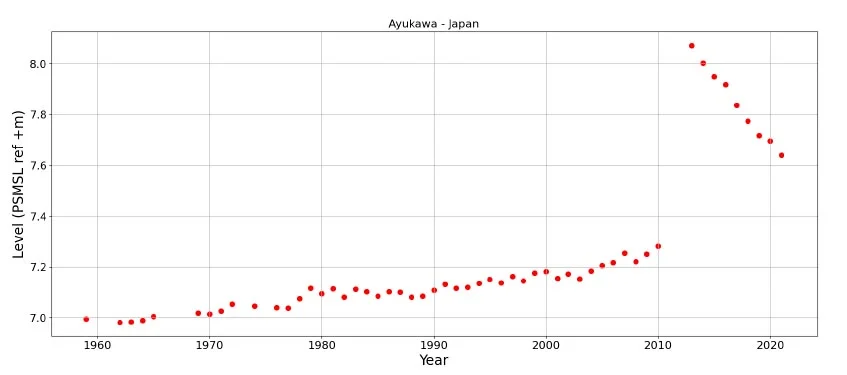
Fig. 9 Source: Voortman et al 2025
However, nine stations did show an acceleration in sea level rise. These stations are mostly located near stations that show no acceleration in sea level rise, making it unlikely that a global phenomenon such as global warming caused by CO2 is the underlying cause. We investigated each of these nine stations and discovered that recent local factors, such as earthquakes (Japan), subsidence due to groundwater extraction or massive construction (as in Bangkok or Mumbai), almost always play a role in the acceleration. Figure 9 shows the extreme change in sea level at the Japanese station Ayukawa, caused by the severe Tohoku seaquake in 2011. After the devastating tsunami that followed, the sea level at the Japanese station was 80 cm higher than before. Since 2011, the sea level in Ayukawa has been falling instead of rising (as was the case until 2011).
In its latest report in 2021, the IPCC published future sea level projections for many locations around the world. This was a commendable addition to previous reports, which only made global statements about sea levels. After all, local information is crucial for practical purposes (protection against high water).
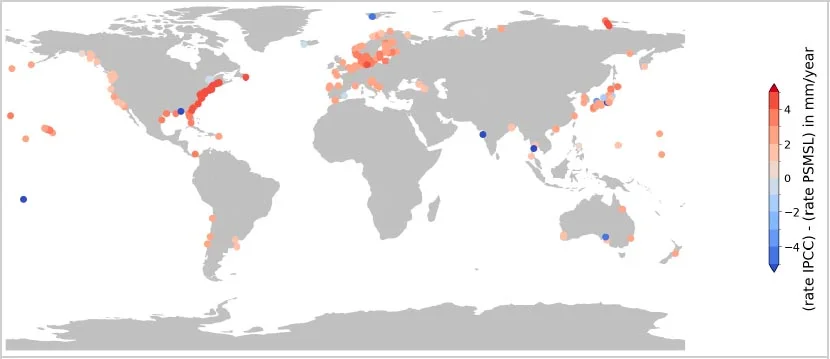
Fig. 10 Source: Voortman et al 2025
We compared the simulated sea level rise in the climate models used by the IPCC for the year 2020 with the measured sea level rise. It turned out that the sea level values simulated by the IPCC are systematically too high, on average about 2 mm/year higher than the measured values, with large regional differences (Figure 10).
Conclusions: our analysis of more than 200 tide gauge stations around the world shows that there is no global acceleration of sea level rise. The research also shows that IPCC models overestimate local sea level rise in 2020.
more news
The Polar Bear Narrative: What Scientists Knew Before Frozen Planet Aired
The Polar Bear Narrative: What Scientists Knew Before Frozen Planet Aired In 2011, BBC viewers were told that polar bears in the Barents Sea were starving due to climate-driven sea ice loss. Later scientific evidence shows that this portrayal was inconsistent with data already available at the time. [...]
Why Is the Southern Ocean Cooling? Three New Scientific Explanations Challenge Climate Models
Surface temperatures in the Southern Ocean around Antarctica have cooled for decades, defying the projections of leading climate models and puzzling researchers worldwide. In this article, physicist Ralph B. Alexander examines three recent studies that propose strikingly different explanations for this unexpected climate anomaly.
Utility Scale Lithium Based Energy Storage Systems
Large-scale lithium-ion battery storage is expanding rapidly, often with limited public discussion of safety and environmental risks. The article below examines a recent white paper by engineer Richard Ellenbogen that analyzes these risks, particularly when such facilities are sited in densely populated or environmentally sensitive areas.
