Climate change computer projections are manifestly false and dangerously misleading
The alleged threat to the planet from human caused climate change has been at the forefront of Australian politics over the recent half century. Every year, just before meetings of the UN Conference of the Parties (COP) to the Climate Change Convention, slight increases in atmospheric carbon dioxide and global temperature are portrayed in the media as harbingers of future doom. Every extreme weather event is made out to be an ill omen of what is to come unless fossil fuels are eliminated.
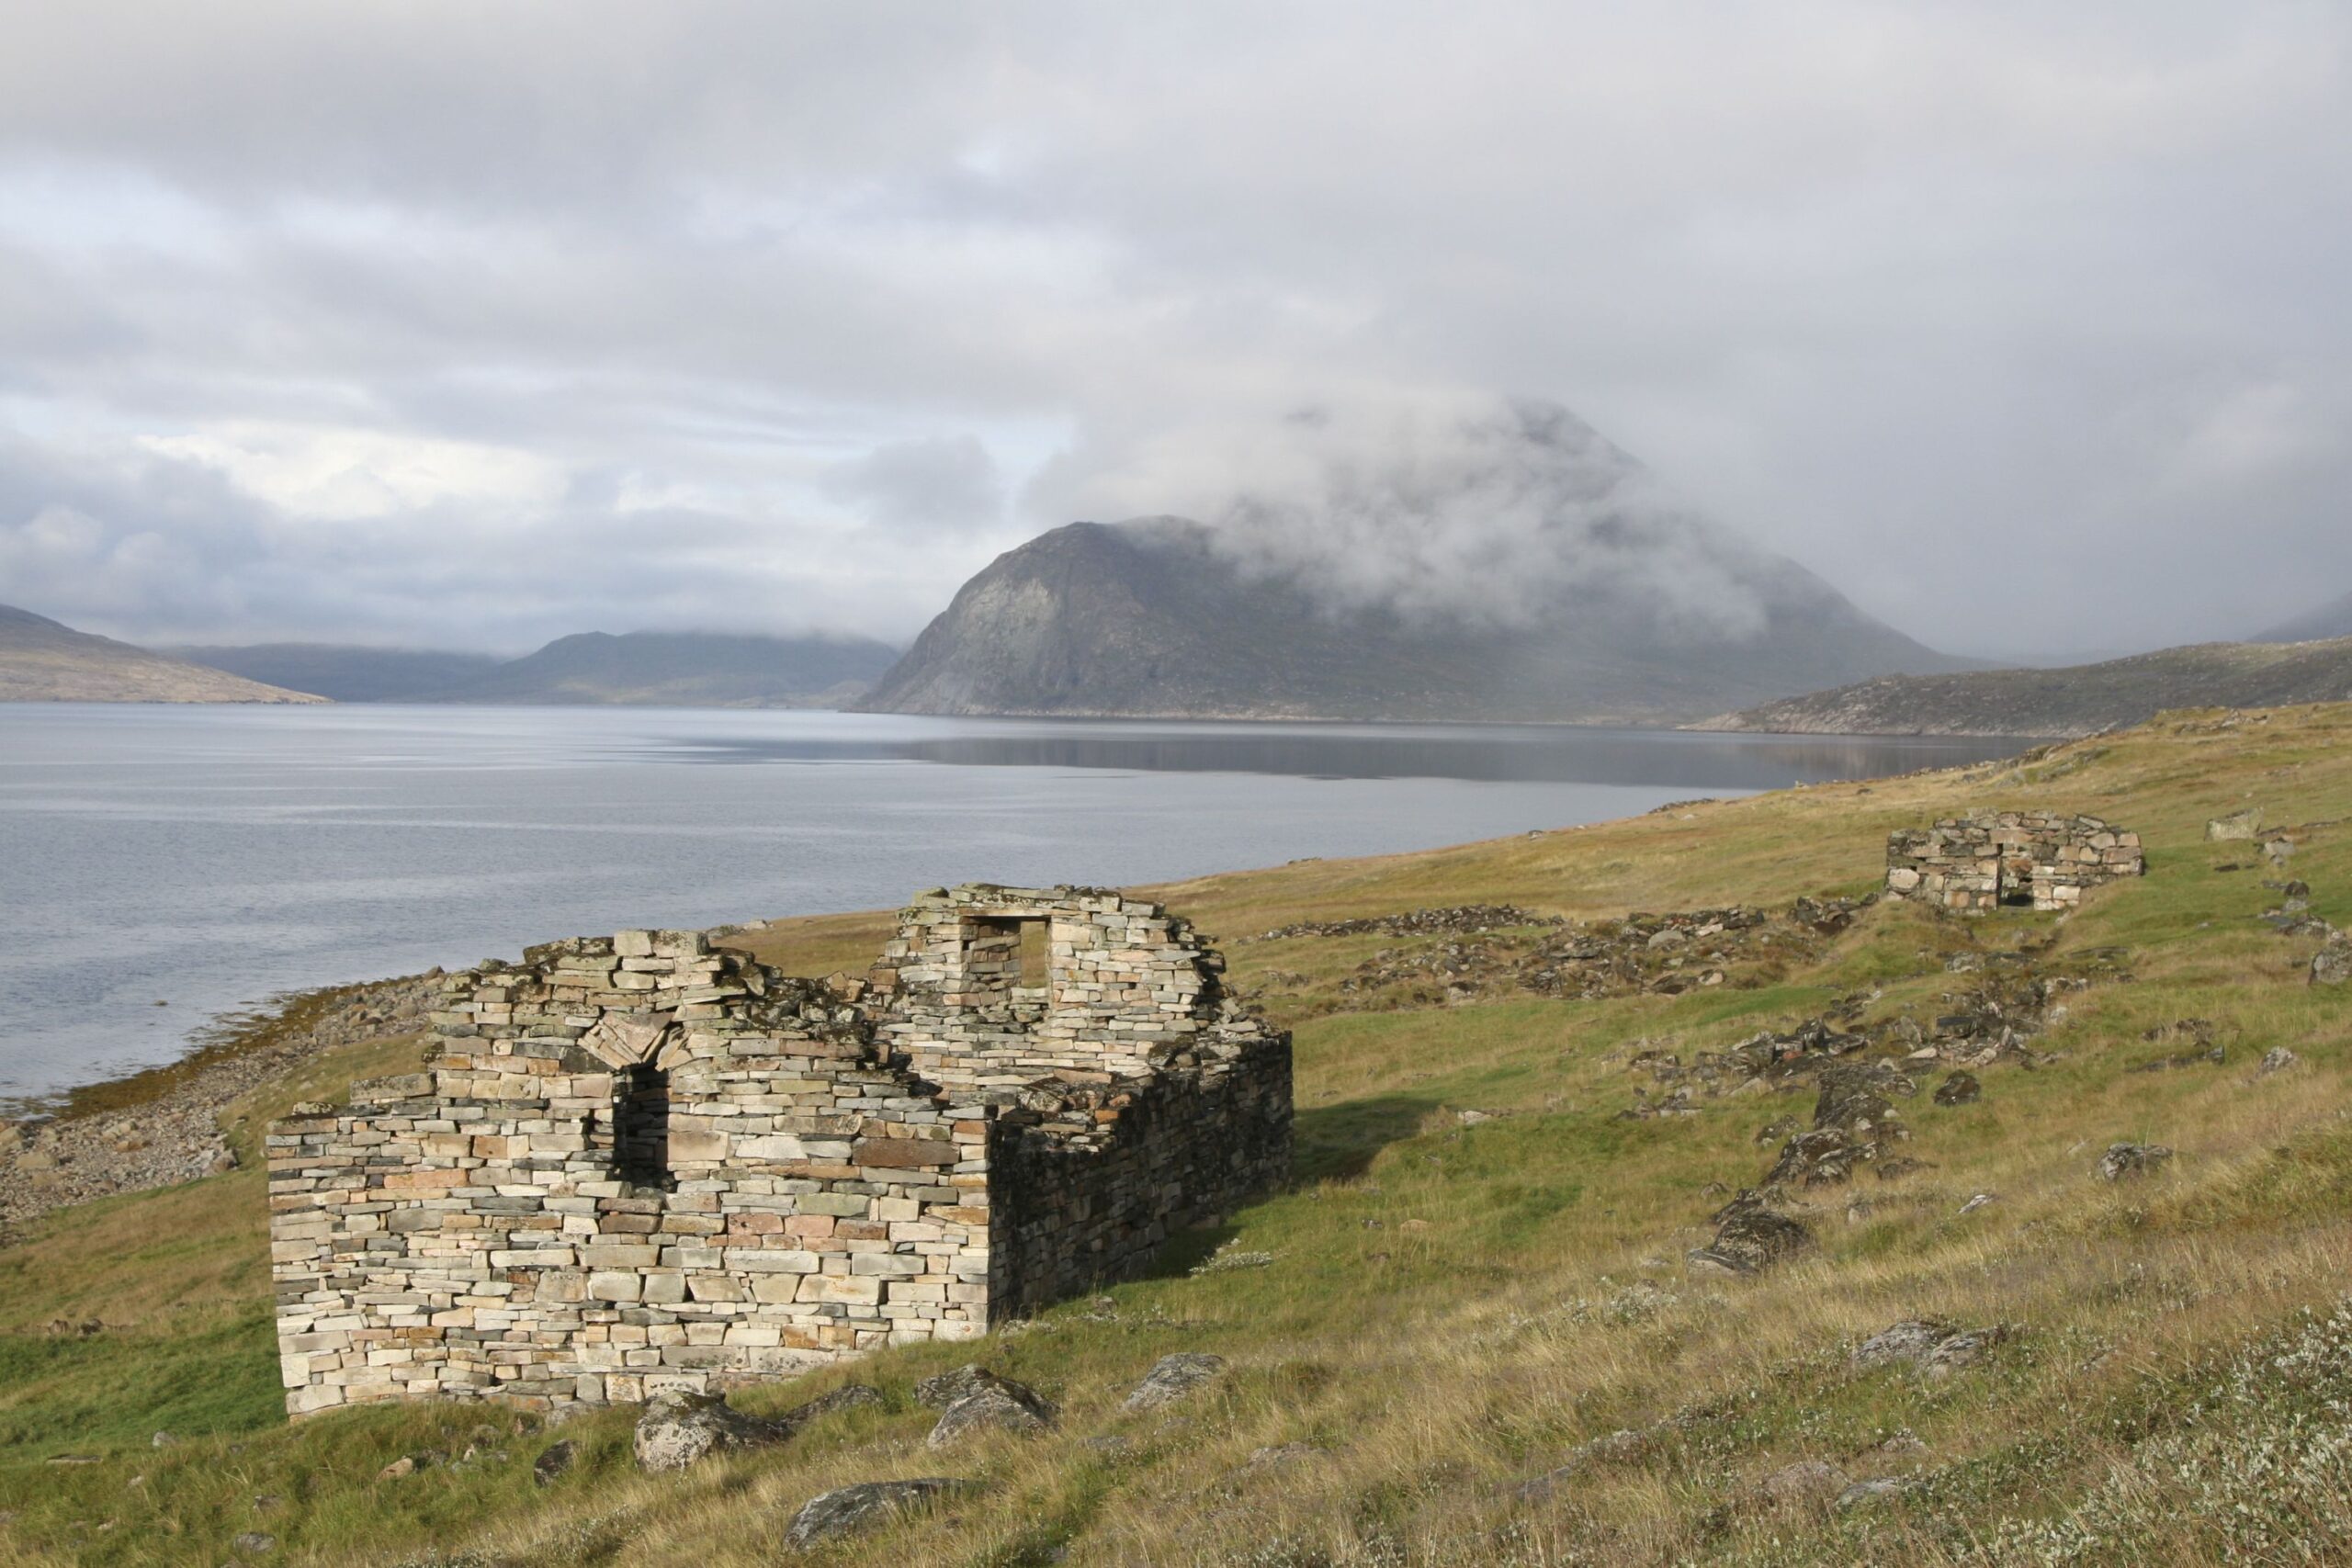
Remains of Viking settlement in Greenland (Source: Shutterstock)
William Kininmonth
Date: 19 February 2026
Globally, billions of research dollars have been expended building complex computer models to reinforce a dire future scenario if carbon dioxide emissions are allowed to continue to increase at historical rates. According to the models, Earth’s temperature will rise several degrees Celsius by the end of the century, making many regions unliveable. Also, the polar ice caps might melt causing sea level to swamp low lying coastal regions, including many large cities. There might even be ‘tipping points’ leading to runaway global warming.
Net Zero
Many in the community are voicing doubt as to the reality of the alleged danger. There is little evidence of unprecedented weather extremes or dangerous climate change. What there is evidence for is an enormous cost burden in the so-called transition to a non-fossil fuel powered economy – the Net Zero objective. There is good reason for scepticism.
Anthropogenic global warming is claimed to be well founded in science. Indeed, reports of the Intergovernmental Panel on Climate Change (the IPCC) suggest that there is a consensus about the scientific basis. However, I am reminded of a saying that my supervisor at graduate school would quote: “There are no Gods in meteorology. If you cannot work something out from first principles, then you do not understand it”. Neither first principles of science nor real-world data support the anthropogenic global warming hypothesis.
The most often quoted statement is that the greenhouse gases of the atmosphere (principally water vapour, but also minor gases such as carbon dioxide, methane, ozone, oxides of nitrogen, etc.) absorb radiation from the surface to act like a blanket and keep Earth warmer than it would otherwise be. Adding more carbon dioxide will thicken the blanket to make Earth hotter. This is only partially true. Certainly, the gases absorb radiation emitted by the Earth, but they also emit radiation independently of what is absorbed. Indeed, the greenhouse gases emit more radiation, to space and back to Earth, than they absorb.
Erroneous metaphor
Greenhouse gases cool the atmosphere, but the cooling tendency is offset by the flow to the atmosphere of heat and latent energy contained in evaporating water vapour. Acting like a blanket is an erroneous metaphor for the role of greenhouse gases. Sustaining Earth’s temperature requires a more complex construct than greenhouse gases and radiation.
Satellite instruments provide near global coverage of important climate-related data. These data have been collected and stored by various national meteorological services. With nearly half a century of data available, the datasets are a valuable real-world resource for studying Earth’s climate and how it is changing.
A revelation of the climate data is that the temperature of the tropical atmosphere follows, with a lag of about 6 weeks, the temperature of the equatorial ocean surface where temperatures are warmest. Over the tropics, heat and latent energy flows from the surface to the atmosphere and the energy is drawn to the equatorial region by the Trade Winds. It is deep convection across the equatorial region that distributes the heat and latent energy through the atmosphere to offset the loss of radiation energy.
Arctic warming
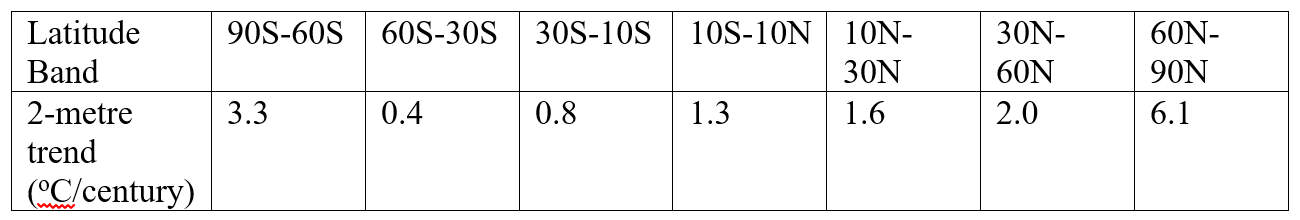
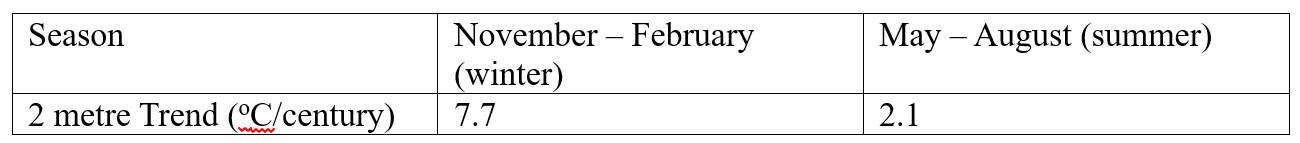
The second revelation is that recent warming has not been globally uniform. The IPCC’s frequent use of global average temperature as an index of climate change is misleading. Warming was essentially absent from latitudes of the Southern Ocean. The rate of warming over the equatorial ocean surface has been less than 1oC per century. Warming has been greatest over the frozen polar regions. The most rapid rate of warming, at nearly 8oC per century, has been over the Arctic during the darkness of winter. This compares to an Arctic warming rate of only about 2oC per century during the sunlit months of summer.
The IPCC explanation of Earth’s warming, that warming is due to an enhanced greenhouse effect, cannot be valid when the greatest warming has been occurring over the frozen Arctic during the darkness of winter. There is net radiation loss to space over the Arctic during winter and warming can only occur if the rate of transport of energy from the tropics is increased.
A more logical explanation for Arctic warming is that additional heat and latent energy have flowed to the atmosphere as the tropical oceans have slowly warmed. The temperature of the tropical atmosphere has been constrained by the equatorial ocean surface temperature. It follows that much of the additional energy has been transported to higher latitudes. The energy transport is a maximum during winter months, the time when observations show that greatest warming over the poles has occurred.
Ocean temperatures
There is also no valid link between the additional atmospheric carbon dioxide and rising ocean temperatures. Carbon dioxide and water vapour absorb and emit radiation over common wavelength bands. At tropical temperatures the concentration of water vapour is about 50 times greater than carbon dioxide. Radiation emitted by carbon dioxide is largely absorbed by the water vapour. There is no significant increase in radiation to warm the surface as carbon dioxide concentration increases.
Is a continuation of recent warming, focussed as it has been over polar regions in winter, likely to be dangerous for the planet? The most obvious impact of recent warming has been an earlier onset of spring thaw and a delay in autumn freeze over the middle and high latitudes of the Northern Hemisphere. This has increased the duration of ice melt to cause a reduction in the mass of ice sheets and retreat of mountain glaciers. However, the increase in annual ice mass loss is limited by the transport of heat from the tropics. The rate of sea level rise will continue to be modest and manageable.
The recent middle and high latitude warming has produced benefits. The earlier thaw and later freeze have extended the growing seasons over these latitudes. Anecdotal reports from Northern Europe and North America suggest that the growing season has lengthened by as much as 20 days. NASA satellites clearly show a greening of the planet as the temperature constrained biosphere has responded to the longer growing season. Importantly for civilisation, the longer growing season, with technology and the fertilising effect of more carbon dioxide, has enormously increased food production.
Greenland
History suggests that the most recent warming has followed a pattern of middle and high latitude temperature change like that experienced in earlier times. During the Roman occupation of Britain, it was possible to grow crops, including vines, over northern parts. With the onset of the cold of the Dark Ages, winter temperatures dropped and rivers froze over. Much previously agricultural land of Britain and Europe returned to a forest state. During the warmth of the Medieval Period the Norse colonised Arctic regions, including settlements on Greenland. The return of cold during the Little Ice Age brought demise of the Greenland settlements, wintertime freezing of European rivers, and the extension of glaciers in the alps.
There is clearly a disconnect between the climate scenarios projected by computer models and the characteristic regional climate trends recorded over the recent half century. Recent changes are consistent with the natural millennium scale climate variations gleaned from historical accounts. History suggests that civilisations prosper during the warmer phases but suffer during the colder phases of the cycle. This is contrary to the dire predictions of an ever-warming planet for future generations that activists have gleaned from computer models.
In its first assessment report, the IPCC claimed that the only way to ascertain the relationship between atmospheric carbon dioxide concentration and global temperature rise was by way of computer models. The divergence of climate projections from recorded data suggests a need for a thorough reassessment of how additional carbon dioxide is incorporated in computer models. In their present state the computer projections are manifestly false and dangerously misleading.
SUPPORTING EVIDENCE
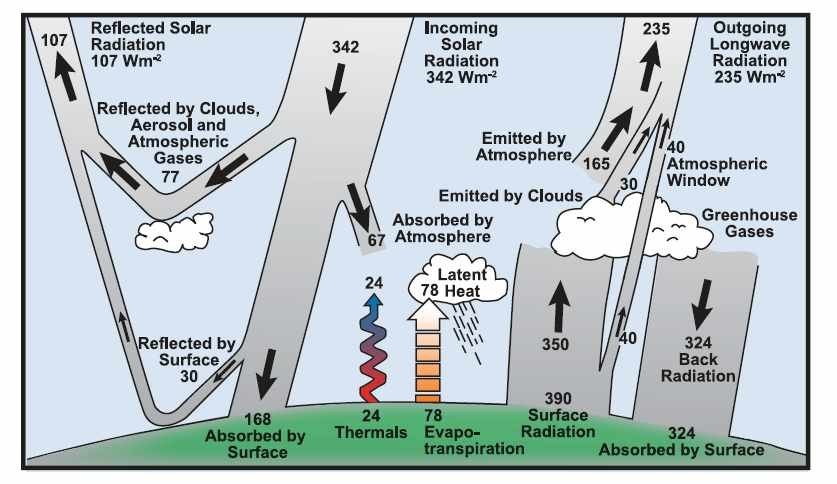
1. Greenhouse gases emit more radiation than they absorb and tend to cool the atmosphere. The global and annual average Earth energy budget is from an IPCC assessment and based on the work of Kiehl and Trenberth. The greenhouse gases, clouds and aerosols emit 195 W/m2 to space and 324 W/m2 back to the surface (Total emission 519 W/m2). The greenhouse gases, clouds and aerosols absorb 350 W/m2 emitted from the surface and 67 W/m2 of solar radiation (Total absorption 417 W/m2). That is, the loss of radiation energy at a rate of 102 W/m2 cools the atmosphere. The radiation loss is offset by a flow of heat (24 W/m2 and latent energy of evaporation (78 W/m2) from the surface to the atmosphere.
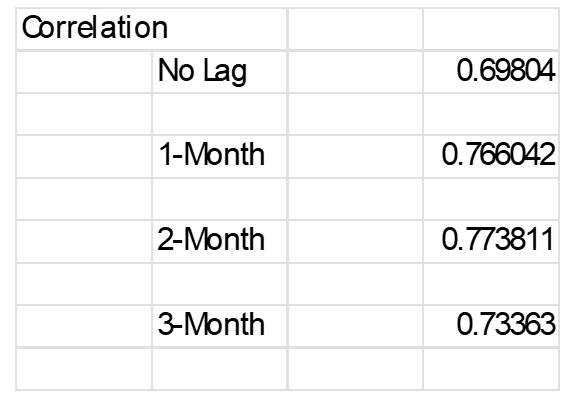
2. The temperature of the tropical atmosphere is regulated by equatorial ocean surface temperature. The chart is of equatorial sea surface temperature (blue) and 700mb (approximately 3km altitude) temperature (red) since 1979 (Latitudes 10S to 10N). The major interannual fluctuations represent El Nino and La Nina events. The rate of warming of ocean temperature (trend) has been 0.65oC/century. The detrended correlation between ocean surface and 700mb temperatures is 0.70.
(Data are from the NCEP/NCAR R1 dataset)
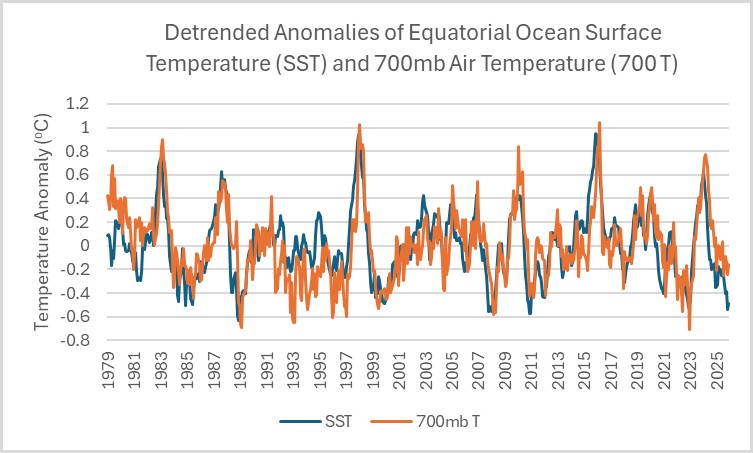
3. Air temperature follows ocean surface temperature. When air temperature is lagged the correlation is a maximum between one- and two-months lag. That is, the air temperature follows the ocean temperature with a lag of between one- and two- months.
4. Global Average temperature is a poor index for representing climate change. The recent (1979-2025) 2-metre temperature trend has varied significantly across latitude bands.
{Data from the NCEP/NCAR R1 dataset)
5. Over the Arctic there has been a significant bias towards wintertime warming
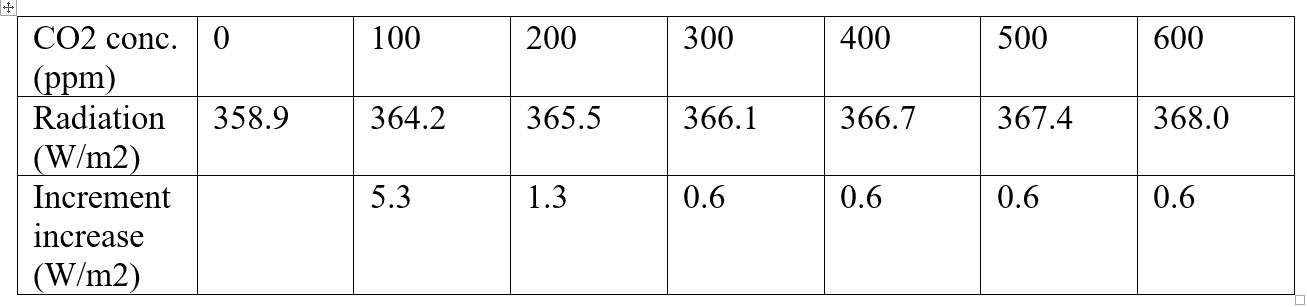
6. Carbon dioxide has little influence on Earth’s surface temperature. Earth’s surface temperature is elevated because the radiation emissions from the greenhouse gases, clouds, and aerosols reaching the surface reduce the net longwave radiation loss from the surface. Additional carbon dioxide concentration in the atmosphere has little impact on surface temperature because there is little change in longwave radiation reaching the tropical surface as carbon dioxide concentration increases. The calculations below are made using the MODTRAN radiation transfer model and are for the tropical atmosphere with no clouds and constant temperature. Since industrialisation, for each 100ppm increase in carbon dioxide concentration the increase in radiation emitted by the greenhouse gases and reaching the surface was about 0.6W/m2. That is an increase of 0.3 percent of the radiation emitted by water vapour. Note that from the last glacial maximum 20,000 years ago to preindustrial times the carbon dioxide concentration increased from near 200ppm to near 300ppm (an increase of only 100ppm). During this period the polar ice sheets covering much of North America and northern Europe melted and sea level rose about 130 metres. Since industrialisation the carbon dioxide has increased by more than 100ppm, but sea level rise has been insignificant. The evidence does not suggest carbon dioxide concentration is influential in changing Earth’s climate.
William Kininmonth is a retired meteorologist, former head of Australia’s then National Climate Centre, and a former consultant to the World Meteorological Organization.

more news

The greenlash is here: Britain cannot afford Net Zero and democracy at the same time
The Net Zero revolution was supposed to save Britain. Instead, it’s breaking it. As the country plunges into an energy affordability crisis, even Westminster insiders are starting to question whether the grand green experiment has gone too far.

Dr. Michael Connolly (1949-2025)
Last month, on August 25th, 2025, CERES co-founder, Dr. Michael Connolly, unexpectedly passed away. He is survived by his wife, Dr. Imelda Connolly, their four children – Stephen, Ronan (also a CERES co-founder), Orla and Leona – and six grandchildren.
The Great UN Climate Con
The United Nations Framework Convention on Climate Change (UNFCCC), signed at the Rio Earth Summit on June 12, 1992, is not just another communiqué.

