Climate Change over the past 4000 Years
I last wrote about Climate Change and Civilization for the past 4,000 Years in 2016. Since then, a lot has changed, and I’ve learned a lot more about the subject. First, we learned that various air and sea temperature proxies, such as ice core δ18O or tree rings, are all different. For a discussion of some temperature proxies used and the problems with them, see here. Proxies have different accuracies, they are often sensitive to the temperature of different seasons, and they have different temporal resolutions. Thus, as pointed out by Soon and Baliunas in 2003, they are all local and “cannot be combined into a hemispheric or global quantitative composite.”
The global average surface temperature (GAST) reconstruction relied upon in the IPCC AR6 report was by Kaufman, et al. The authors admit that the average spacing of each temperature (the temporal resolution) is 164 years. Thus, to compare the entire global instrumental temperature record to the proxies in a valid way, one must average all the daily readings since 1860 into one point. That is, the rate of warming since 1860 is irrelevant, the proxy record cannot see a 164-year increase. The problem of comparing daily modern instrumental temperature records to proxies is discussed by Renee Hannon here.
Temperature Proxies
Most temperature proxies are sensitive to only one season, yet it is clear that seasonal temperatures vary at different rates and yearly average temperatures vary differently than seasonal temperatures. Mixing them statistically to create an accurate GAST record of the distant past is not possible. This problem is discussed in more detail here and here. Further most proxies are affected by precipitation frequency and/or CO2 levels as well as temperature. We know CO2 is higher today than in the past few thousand years and cannot correct for precipitation frequency or amount.
While combining hundreds of proxies into one composite “global” or “hemispheric” record is a fool’s errand, we can look at high-quality, high-resolution local proxies from multiple places to get a qualitative sense of global or hemispheric climate changes, which is also what Soon and Baliunas did in 2003. Two records are especially helpful, they are the Greenland ice core record by Vinther, et al. and the Indonesian Throughflow 500-meter water depth record from the Makassar Strait by Rosenthal, et al. The Makassar Strait record is representative of northern Pacific sea surface temperatures and the Vinther Greenland record is representative of air temperature in the Greenland-Renland-Agassiz area. The Vinther record is superior to the more commonly used GISP2 record (Alley, 2004) & (Alley, 2000) because it accounts for elevation changes and ice flow. Both corrupt the GISP2 reconstruction.
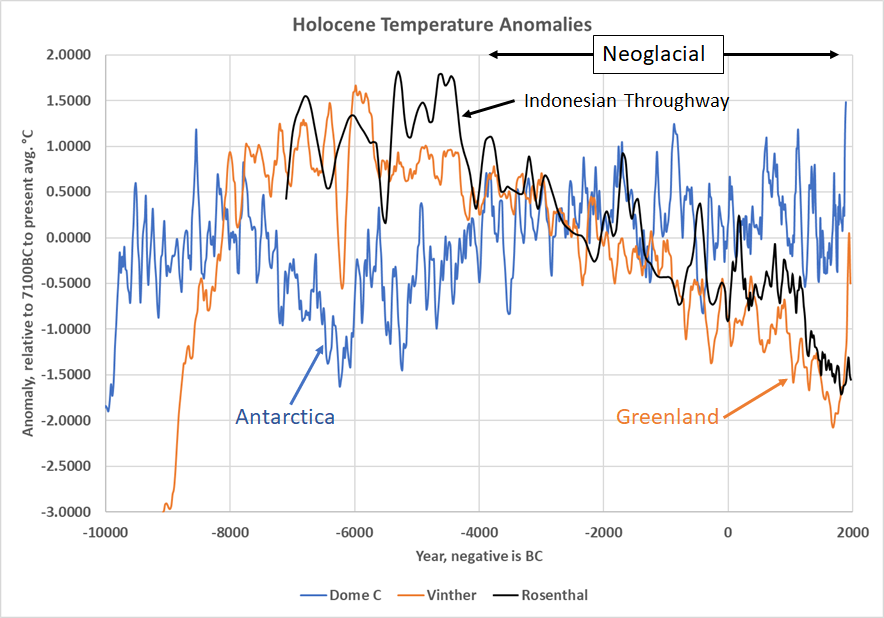
Both the Vinther and Rosenthal temperature records have a 20-year resolution over our 4,000-year period, which is a good resolution for proxies. Accuracy is good in both records and about ±0.3°C. Both are Northern Hemisphere proxies but are located 9,500 miles apart. They are compared to a comparable (10-year resolution) Antarctic proxy (Jouzel, et al., 2007) in figure 1. As you can see, averaging Northern Hemisphere proxies with Southern Hemisphere proxies is not always a good idea, temperature trends vary with latitude.
Figure 1. Proxy temperatures for the Holocene from Antarctica (Dome C, Jouzel et al., 2007), Greenland (Vinther), and Indonesia (Rosenthal). The Neoglacial climatic period is labeled. It is a Northern Hemisphere temperature decline.
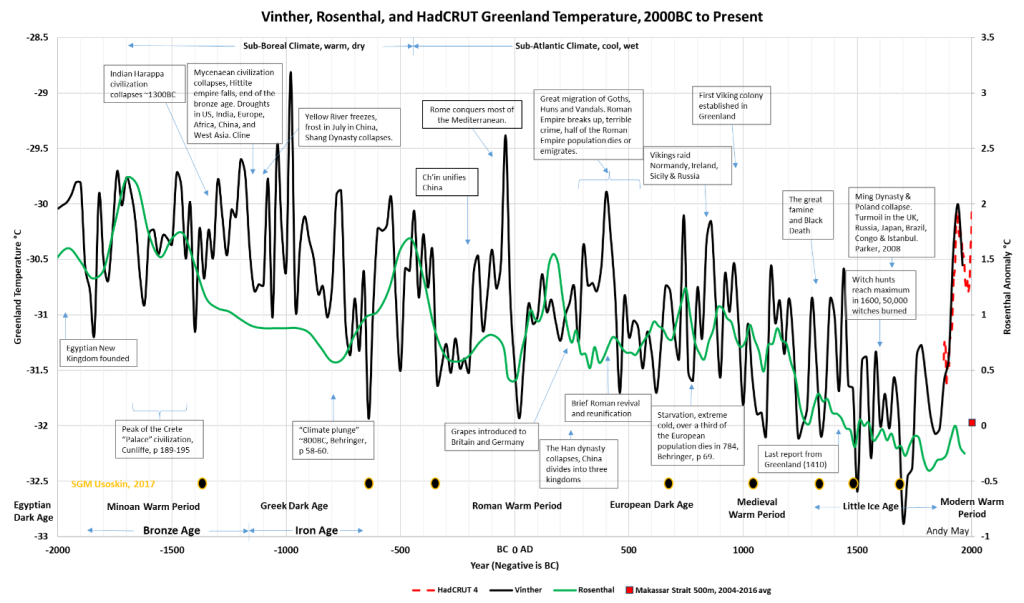
As figure 1 suggests the long decline in temperature labeled the “Neoglacial” is mainly a Northern Hemisphere phenomenon, this is more clearly seen in figure 1 here. Figure 2 compares the Vinther and Rosenthal records from figure 1 with selected historical events and Usoskin’s solar grand minima (SGM) record (Usoskin, 2017) shown as orange outlined black dots. Notice the smoothed version of the Vinther record is plotted in figure 1 and the unsmoothed 20-year record is plotted in figure 2. To see figure 2 in full resolution, click on the image or here. The figure prints well on 8.5×11 inch or A4 paper.
The Blytt-Sernander climatic periods (Schrøder, et al., 2004) are identified at the top of figure 2. Below that the Vinther and Rosenthal proxy temperature records are plotted along with major historical events. The red dashed line on the right is a smoothed HadCRUT4 composite of the six populated grid cells (meaning grid cells with temperature values) near Greenland that have sufficient data since 1850. The line was adjusted vertically to the Vinther record where they overlapped. Both the Vinther and the 20-year smoothed HadCRUT4 records show a peak near 1934. The Rosenthal record is from 500 meters down in the Makassar Strait in Indonesia. The red box is the average temperature, at the same depth, from 2004-2016, from the University of Hamburg global ocean climatology database (Gouretski, 2019).
Figure 2. The Vinther (black) and Rosenthal (green) proxy temperature records compared to major historical events. The Greenland area HadCRUT4 anomaly is a dashed red line and the University of Hamburg Makassar Strait 500-meter temperature is shown as a red box. Click on the image or here to see in full resolution.
Major historical climatic periods are identified below the solar grand minima. Both proxies show a decline in Northern Hemisphere temperature that bottoms out between 1700 and 1810. Taken together they show peaks from 800 to 1000AD (the Medieval Warm Period), 500BC to 400AD (Roman Warm Period), and 1700BC to 1000BC (Minoan Warm Period). Significant differences in the proxies appear from 1400 to 800BC, 200BC to 0AD, and 300 to 500AD.
Historical Details
In 2000BC the most advanced cultures in the world were in the eastern Mediterranean and they were in disarray. The Egyptian Old Kingdom had collapsed and was in the Egyptian Dark Age, before that the Akkadian Empire (mostly in present day Iraq) had collapsed. What grew out of the chaos were the Egyptian New Kingdom in 1975BC and the development of the great Minoan “Palaces” on Crete and the surrounding islands. The Minoans had the most advanced ships of the time and traded widely. The Minoan trading culture peaked between 1690BC and 1450BC when an unknown catastrophe destroyed all the palaces except Knossos on Crete (Cunliffe, 2008, p. 190). Knossos survived until the Mycenaean and Hittite civilizations collapsed in the great catastrophe of 1177BC (Cline, 2014).
Farther east, there was an advanced civilization in northwest India and Pakistan called the Harappa. While the Harappan civilization can trace its roots to 5500BC or earlier, the mature Harappan period existed between 2600BC and 1300BC when it collapsed. Although the Mesopotamian and Egyptian civilizations pre-date the Harappan, it was probably larger than they were (Britannica).
In China, the Shang Dynasty ruled most of the Yellow River valley from around 1600BC until about 1046BC (Britannica) when it collapsed and was overthrown by King Wu of Zhou. The final decades of the Shang Dynasty were very turbulent climatically and unusually cold and dry, with common dust storms. Ice appeared in the Yellow River and there were frequent harvest failures and famines. The poor weather aided King Wu’s conquest (Behringer, 2010, p. 57).
In 800BC there was a “Climate Plunge,” sometimes called the Hallstatt disaster, in Europe and the Middle East (Behringer, 2010, p. 60). It marks the beginning of the Iron Age in Europe and is associated with a drop in temperatures, longer winters, and glacier advances. Large scale migrations occurred, and civil wars broke out in Egypt.
China was finally unified by Ch’in about 200BC, but chaos ensued after his death and the Han Dynasty formed in 202BC. It lasted until 220AD. This is also the period when the Roman Empire was at its peak (Behringer, 2010, p. 62).
Grapes were introduced to Britain by the Roman Emperor Probus in 280AD. A worsening climate initiated the so-called “great migration” period about 250AD, it led to troubles in the Roman Empire and the collapse of the Han Dynasty in 220AD. Later, around 375 the Huns invaded Europe, driving the Germans toward Rome, which they destroyed. Rome had a brief revival about 400AD, but eventually collapsed. A climatic disaster about 537AD, possibly due to a major tropical volcanic eruption, aided in the fall of the Empire. This was near the beginning of the European Dark Age.
One of the most catastrophic climate disasters in recorded history occurred around 800 AD. In 843 a starving wolf burst into a church in Sénonais, France during services and attacked the flock. Charlemagne deployed teams of wolf hunters in every county of his kingdom. A third of the people in Europe died in 784AD. The decades around 800AD were miserable in Europe. Yet the period was unremarkable in China and Japan. However, the Maya suffered several severe droughts between 760 and 910AD and the Mayan government and nobility disappeared around 900AD amid a severe population decline (Behringer, 2010, p. 71).
Around the mid-800s the Vikings emerged as the North Atlantic warmed and they conquered portions of Britain, Ireland, Russia, France, and Sicily. The Medieval Warm Period began earlier in Northern Europe than in the south, which benefited the Vikings. They settled in Greenland in 985AD and they prospered until around 1410 when the last letter from Greenland arrived at the Vatican. Sometime after 1410 they all perished and some of their farms are now in permafrost. Ships trying to sail to Greenland during this time could not get past the abundant icebergs.
Little Ice Age
While most sources start the Little Ice Age around 1300, it did not begin in earnest until the late 1400s. The most severe part of the Little Ice Age was from about 1645 to 1715, although extremely cold periods occurred from 1310 to 1322, 1560-1600, and 1800-1850. The period from 1560-1660 became known as the “age of the witch persecutions” (Behringer, 2010, p. 130). There had to be someone or some group to blame for the lousy weather, and the group most often blamed were older single women. Others claimed the weather was a punishment from God for sins such as sodomy or staging plays.
The effect on society of the poor weather of the Little Ice Age was horrible. The mid-1600s saw more wars around the world than any other era until the 1940s (Parker, 2008). In the 1640s, the Ming Dynasty and the Polish-Lithuanian Commonwealth collapsed. Serious revolts shook the UK, Spain, Russia, France, and Istanbul. In London, King Charles I was the first king to be put on trial. One of China’s later emperors, Yongzheng, estimated that during this period over half the Chinese population died (Parker, 2008).
In France the Fronde Revolt (1648-1653) and the resulting illness, want, and misery may have killed two-thirds of the population of the villages around Paris. Thomas Hobbs wrote in 1651 that the “life of man is solitary, poor, nasty, brutish, and short” (Parker, 2008).
It wasn’t just the cold that made the Little Ice Age miserable, it was also drought, severe storms, and the occasional summers with extreme heat (May & Crok, 2024). The weather in the Little Ice Age was much more extreme than now. I have written elsewhere that storminess was worse during the Little Ice Age see figure 6 here. This is logical since colder periods have a steeper temperature gradient from the tropics to the poles and it is the gradient that powers storms.
As Geoffrey Parker writes, the extraordinary claims of misery of the people that lived in the 1600s have been shown to be correct. It is understandable that many today looking back on the period are skeptical of the stories, but they have been repeatedly shown to be true. The Little Ice Age was real, and devastating to humanity.
Conclusions
Many paleoclimatologists, archeologists, and historians agree that there is a correspondence between the level of solar activity and climate. They also agree that humans do better in warmer times than in colder times. It is time for the “consensus” to face up to the historical and archeological facts.
Download the bibliography here.
more news
Glacier fluctuations don’t yet support recent anthropogenic warming
Holocene glacier records show that glaciers worldwide reached their greatest extent during the Little Ice Age and were generally smaller during earlier warm periods. While glacier length is a valuable long-term regional climate indicator, the evidence does not clearly support the idea of uniform, synchronous global warming.
Challenges to the CO2 Global Warming Hypothesis: (13) Global Warming Entirely from Declining Planetary Albedo
Is the recent warming the result of less reflection of sunlight by the Earth? Two researcher state that declining albedo — not CO₂ — dominates the temperature trend.
Guardian Claims We’re Still Only Approaching the Climate Point of No Return
The Guardian claims the world is edging toward a climate “point of no return,” where unstoppable warming will lock Earth into a catastrophic “hothouse” future. Yet the geological record tells a very different story. Past periods of far higher temperatures and CO₂ levels did not end life or civilization’s prospects — they supported abundance and evolutionary expansion.
