New study finds low CO2-sensitivity again
Solar vs CO2 as climate drivers? A new paper by Frank Stefani compares solar variability and CO₂ emissions as drivers of global sea surface temperatures. Using the solar aa geomagnetic index alongside CO₂ data, the study estimates a transient climate response (TCR) of about 1.1–1.4 K, near the lower end of the IPCC range. The results align closely with other observation-based estimates and highlight the continuing scientific debate about the relative roles of solar activity and greenhouse gases in recent climate change.
Afbeelding gecreëerd door ChatGPT
Andy May
Date: 16 March 2026
Frank Stefani, of the Helmholtz-Zentrum Dresden-Rossendorf, Institute of Fluid Dynamics, has published a very interesting new paper that compares the solar “aa” index and CO2 emissions to global SST (sea surface temperatures using the HadSST4.2 dataset) and finds a CO2 sensitivity (TCR or the “Transient Climate Response”) of 1.1 to 1.4K. This is at the low end of the IPCC TCR range of 1.2 to 2.4K (IPCC, 2021, p. 93), but quite close to the values calculated by Lewis and Curry and Nicola Scafetta (Lewis & Curry, 2018), (Scafetta, 2023), and (Lewis, 2023). Scafetta found a plausible range of TCR (versus HadSST4.2) of 1.0K to 1.2K and Lewis & Curry report a range of 0.9K to 1.7K for TCR versus HadCRUT4. The estimates are compared in Table 1.
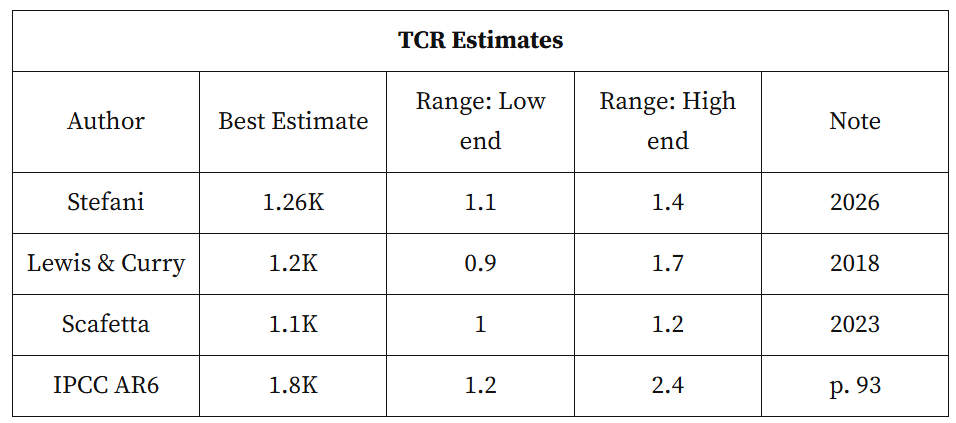
Table 1. Estimates of TCR, or Transient Climate Response to a doubling of CO2. Sources: (Stefani, 2026), (Lewis & Curry, 2018), (Scafetta, 2023), and (IPCC, 2021, p. 93).
All the estimates in table 1 are based on regression models of varying complexity and all attempt to account for the influence of solar variability. The Lewis and Curry estimate does not incorporate a solar activity proxy directly but does use the Atlantic Multidecadal Oscillation (AMO) as an indicator of natural climate variability, which is, in large part, solar variability. Stefani uses the aa index of geomagnetic activity, essentially how disturbed Earth’s magnetic field is by the sun. It is measured in nanoteslas (nT).
Nearly every observable form of solar variability is a magnetic phenomenon at its core, including sunspots, flares, and solar wind variability. Thus, the aa index is a good indicator of changes in the sun’s state and output. The aa index as a measure of solar-geomagnetic coupling has been measured consistently since 1868.
Table 1 shows that Stefani’s aa index + CO2 model compares well to Lewis and Curry’s AMO + CO2 model and Scafetta’s solar proxies + CO2 model. Scafetta uses three estimates of total solar irradiance (TSI) in his study, although he acknowledges that variations in TSI may be only ~20% of the sun’s total influence on Earth’s climate. None of these observation-based models support the high-end IPCC TCR estimate of 2.4K per doubling of CO2 or their best estimate of 1.8K, but all are near the lower end of the IPCC range. The Lewis (2023) correction to the Sherwood (2020) assessment of ECS and TCR relied upon in AR6 is not included in the table. However, after changing Sherwood’s subjective Bayesian assessment of multiple estimates of TCR to an objective Bayesian assessment, Lewis calculated a TCR of 1.37 to 1.4 depending upon the assumptions made. This is still close to the other observation-based objective estimates in Table 1.
Stefani found that the solar aa index can successfully predict HadSST4.2 up to 1990-2000 on its own. After 1990 to 2000 the role of CO2 in the regression increases significantly. In figure 1, Stefani’s robust aa index weight of 0.04 K/nT (that is the HadSST4.2 anomaly temperature in °C per the aa index in nanoteslas) plus CO2 with a sensitivity of 1.26K per doubling is shown as a thin dark gray line. It is compared to the HadSST4.2 anomaly (shown as black dots). His projected aa index plus CO2 at 1.26K per doubling function to 2100 is shown as a red line. The maximum departure in 2023 and 2024 looks startling, but we need to remember that this follows two strong El Niños (2018-19 & 2023-24) and the Hunga Tonga volcanic eruption. In particular the El Niño from June 2023 to May 2024 was one of the strongest El Niños on record. The HadSST4.2 global anomaly has been falling since September 2024. Thus, a portion of the difference between the aa index plus CO2 function and HadSST4.2 may just be ENSO, the Hunga Tonga eruption, and weather.
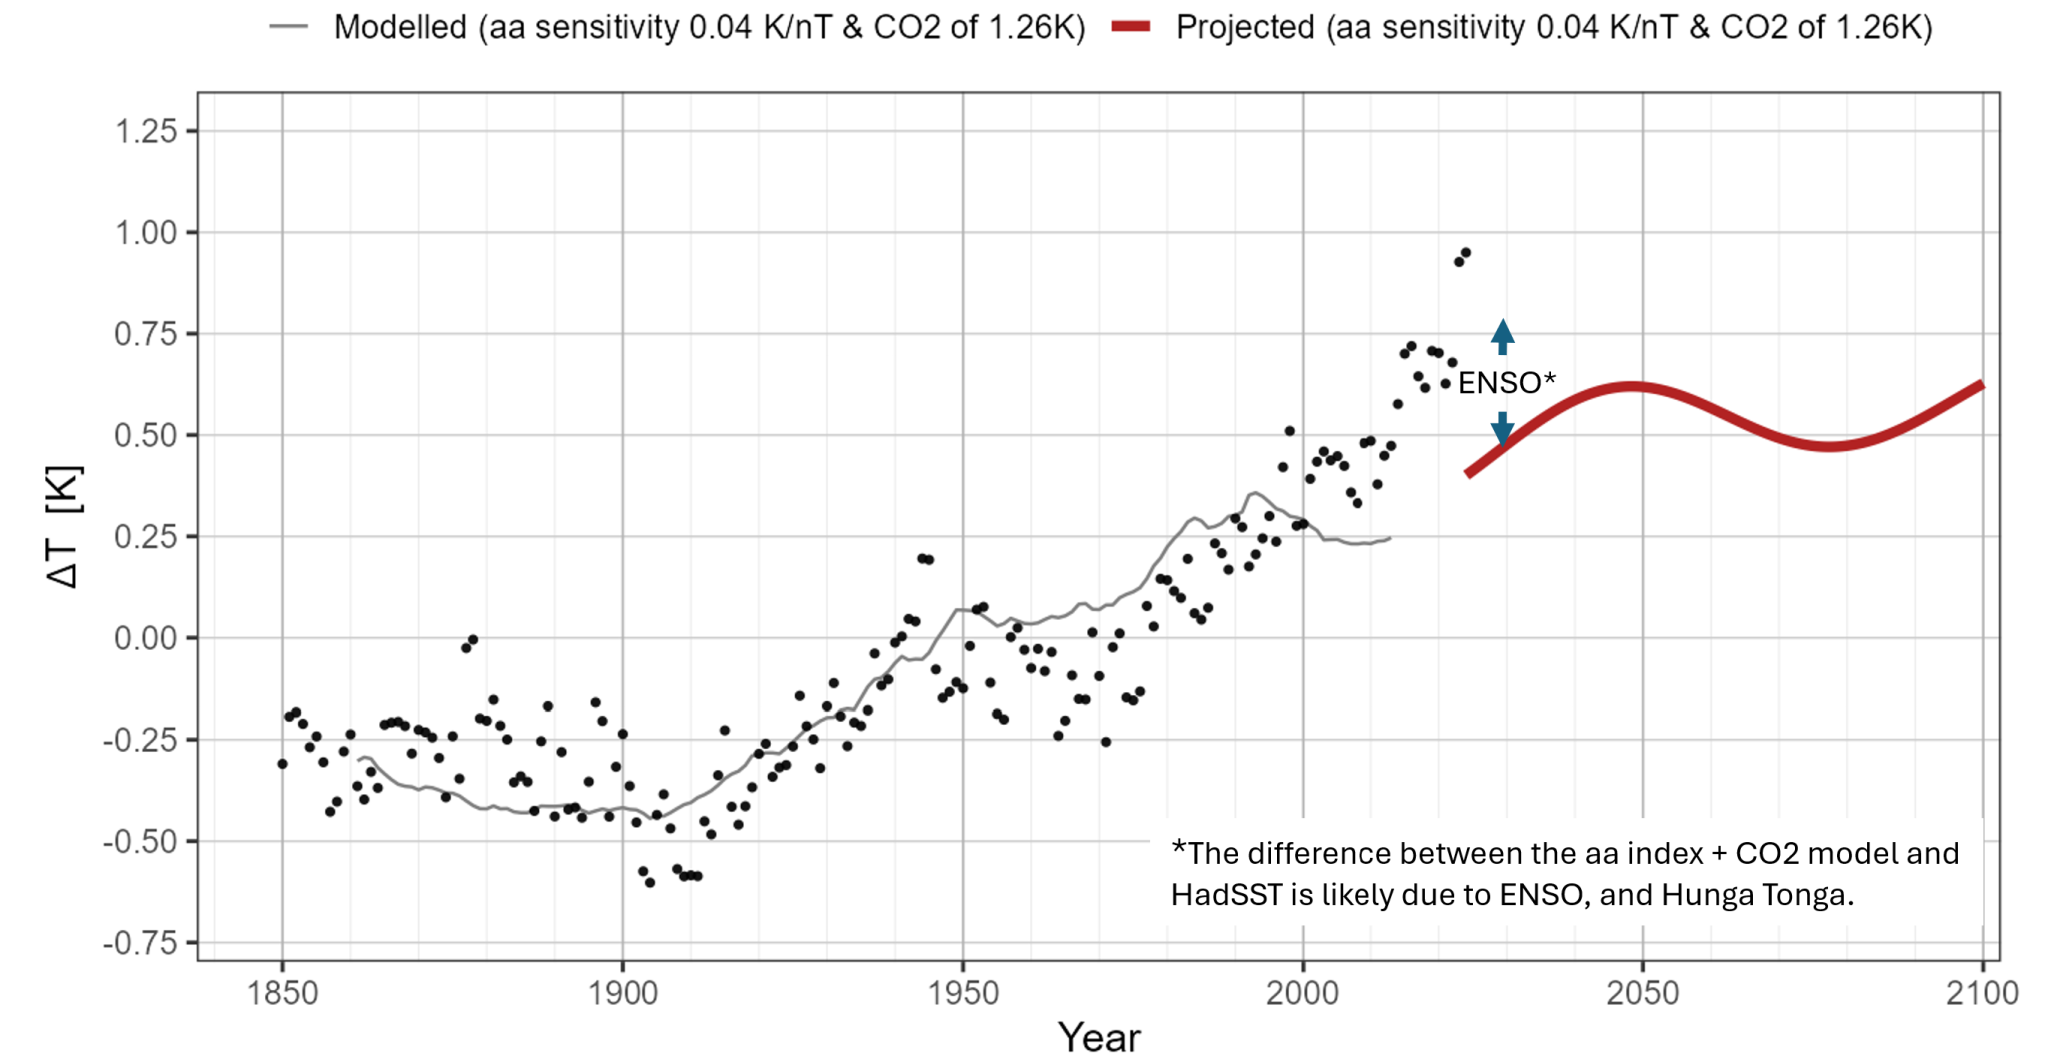
Figure 1. A plot of Stefani’s regression of the aa index on HadSST4.2 as the dark gray line, HadSST4.2 data are shown as black dots, and the aa index projection to 2100 is shown as a red line. Data source: (Stefani, 2026).
Stefani’s optimal model projection to 2100 assumes constant emissions of 30-50 Gt of CO2 per year (roughly current levels) plus a simple linear carbon sink model and predicts a global SST increase of 0.6°C (1.1°F) compared to the standard HadSST4.2 reference period of 1961-1990. Using pessimistic parameters (high CO2 emissions, a low sensitivity to the aa-index, and a high sensitivity to CO2) yields a 2100 temperature increase of ~1K over 1960-1990. This is still a benign result.
A word on Transient Climate Response
The transient climate response is the modeled warming due to increasing the atmospheric CO2 concentration by 1% each year until it doubles, which would take about 70 years. This is different from the commonly cited value of ECS, which is the equilibrium climate sensitivity, or the final warming due to a sudden doubling of CO2. ECS is an untestable number, since it would take over 1,000 years for the atmosphere to completely come to equilibrium after CO2 suddenly doubles. Given the implausible scenario, ECS can never be tested, except in a climate model. Thus, it is not a scientific quantity per Karl Popper (Popper, 1962). TCR on the other hand is very realistic and could be tested given enough time and effort.
Conclusions
The debate over solar vs CO2 as climate drivers remains central to understanding climate sensitivity. The paper is a welcome addition to the growing group of observation-based estimates of climate sensitivity to CO2. It is appropriate that Stefani chose to create his model around HadSST4.2. SSTs are more stable than air temperatures on land and they respond mainly to changes in insolation, whether due to cloud cover changes or changes in the sun itself. The changes in SST due to the greenhouse effect are smaller for the reasons discussed in my previous post. I recommend the paper, it is interesting, significant, and a good read.
Works Cited
IPCC. (2021). Climate Change 2021: The Physical Science Basis. In V. Masson-Delmotte, P. Zhai, A. Pirani, S. L. Connors, C. Péan, S. Berger, . . . B. Zhou (Ed.)., WG1. Retrieved from https://www.ipcc.ch/report/ar6/wg1/
Lewis, N. (2023, May). Objectively combining climate sensitivity evidence. Climate Dynamics, 60, 3139-3165. https://doi.org/10.1007/s00382-022-06468-x
Lewis, N., & Curry, J. (2018). The Impact of Recent Forcing and Ocean Heat Uptake Data on Estimates of Climate Sensitivity. Journal of Climate, 31, 6051-6071. DOI: https://doi.org/10.1175/JCLI-D-17-0667.1.
Popper, K. R. (1962). Conjectures and Refutations, The Growth of Scientific Knowledge. New York: Basic Books. Retrieved from http://ninthstreetcenter.org/Popper.pdf
Scafetta, N. (2023). Empirical assessment of the role of the Sun in climate change using balanced multi-proxy solar records. Geoscience Frontiers, 14(6). Retrieved from https://www.sciencedirect.com/science/article/pii/S1674987123001172
Sherwood, S. C., Webb, M. J., Annan, J. D., Armour, K. C., J., P. M., Hargreaves, C., . . . Knutti, R. (2020, July 22). An Assessment of Earth’s Climate Sensitivity Using Multiple Lines of Evidence. Reviews of Geophysics, 58. https://doi.org/https://doi.org/10.1029/2019RG000678
Stefani, F. (2026). Solar and Anthropogenic Climate Drivers: An Updated Regression Model and Refined Forecast. Atmosphere, 17(3). https://doi.org/10.3390/atmos17030252

This article was first published by Andy May on 2 March 2026 at andymaypetrophysicist.com

Andy May
Andy May is a retired petrophysicist and has published six books. He worked on oil, gas and CO2 fields in the USA, Argentina, Brazil, Indonesia, Thailand, China, UK North Sea, Canada, Mexico, Venezuela and Russia. He specialized in shale petrophysics, fractured reservoirs, wireline and core image interpretation, and capillary pressure analysis, besides conventional log analysis. His full resume is here: AndyMay

more news
New Climate Assessment Report from US DOE
Climate science is baaaack. Energy Secretary Chris Wright has commissioned a new climate assessment report.

When Science Fails, They Call the Lawyers
Inside the UN’s Plan to Criminalize Climate Dissent.
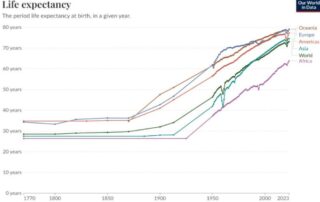
How Fossil Fuels Doubled Human Life Expectancy
Climate activists say fossil fuels are killing us. History and data say the opposite.

