The First Heatwave of the Year… and the Same Old Narrative
March heatwave climate data – How long term temperature records challenge the climate narrative

According to CNN Yuma, Arizona, hit 109 degrees on 20 March, which broke the national March record of 108 degrees set at Rio Grande City, Texas, in 1954 and 1902. (Source: Shutterstock)
Matthew Wielicki
Date: 25 March 2026
A Quick Personal Note
Before getting into the data, I want to briefly share something with you. There are important developments unfolding on my end regarding future roles where I will be directly involved in helping reshape how climate science is interpreted and communicated at a national level. These processes take time and, as many of you know, institutional change moves slowly, but meaningful progress is being made.
Because of this, the pace of my writing may slow somewhat in the near future. I am also considering pausing paid memberships so that everything I publish during this transition is freely available. Nothing is finalized yet, but I wanted to share this with you because your support has been instrumental in making these opportunities possible. There will be more to come soon.
The Headlines Say One Thing… The Data Says Another
Denver and other cities just shattered a March heat record.
The media immediately framed it as further proof of a climate system pushed beyond its limits by human activity.
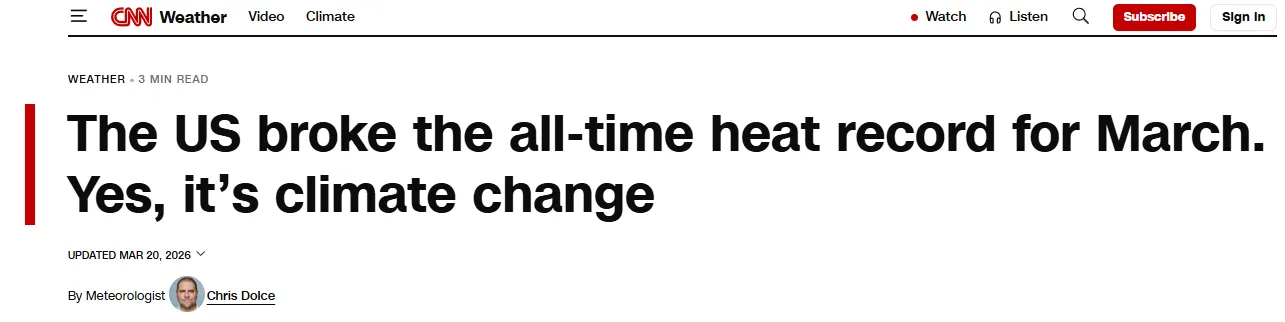
The problem is that the record was set in 1971.
Saturday’s high also broke the record for the highest temperature ever recorded in the month of March, which had just been set Thursday and Friday, when Denver hit 85 degrees. The old all-time March temperature record was 84 degrees on March 26, 1971.
If today’s heat is evidence of something unprecedented, then what exactly was happening in 1971?
That question alone should force a pause before jumping to conclusions. When we step away from the headlines and actually examine the data, a very different picture begins to emerge.
What the Long-Term Records Actually Show
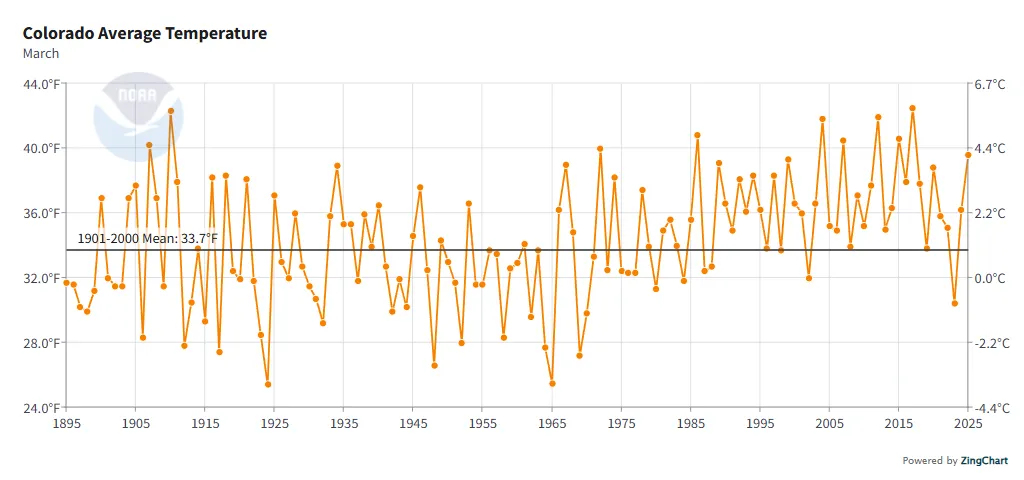
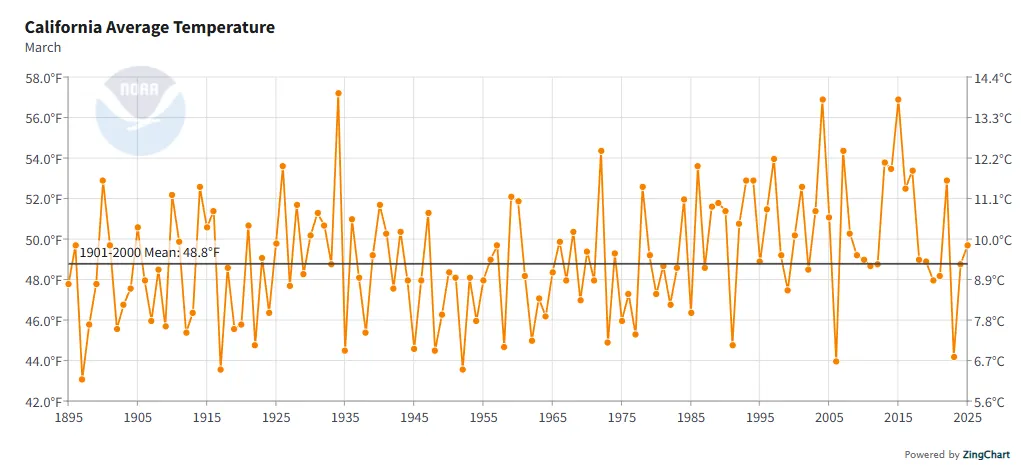
To understand what is really happening, we need to step back and look beyond a single event. The statewide March temperature records for Colorado, California, Arizona, and Washington extend back to the late nineteenth century and provide a much more complete view of the system.
What these records reveal is not stability followed by sudden disruption. They reveal a system that has always been highly variable.
In Colorado, the March temperature record fluctuates dramatically from year to year, with warm periods in the early twentieth century that rival or exceed many modern values.
The same pattern appears in California, where large spikes in March temperatures occur well before the recent period of elevated atmospheric carbon dioxide.
Arizona shows similar behavior, with pronounced warm anomalies scattered throughout the record, including periods in the early and mid twentieth century that are comparable to recent years.
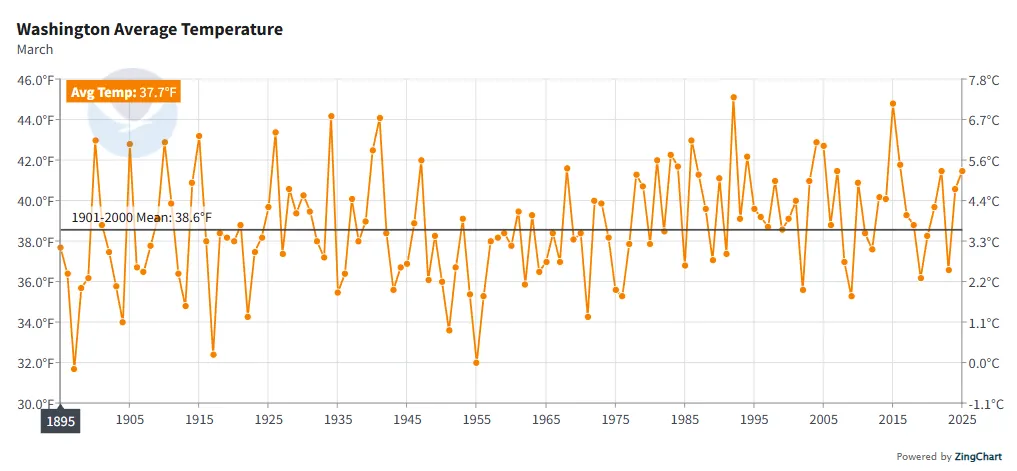
Washington, often thought of as more climatically stable, exhibits the same jagged variability with no clear monotonic progression that would suggest a simple linear relationship with greenhouse gas concentrations.
What stands out across all four states is not a sudden shift or acceleration but persistent variability. Warm years cluster, cool years cluster, and extremes appear throughout the record. The modern period does not stand apart as uniquely volatile or unprecedented. Instead, it fits within a long-established pattern of fluctuation.
This Is Exactly What Natural Variability Looks Like
The climate system is not static. It is dynamic, nonlinear, and influenced by a wide range of interacting processes. When we extend a record over more than a century, the probability of encountering extreme values increases naturally. This is not evidence of a system breaking down. It is evidence of a system being observed long enough to reveal its full range.
Every year, somewhere on the planet, a record is set. That is not evidence of a changing system. It is the expected outcome of a long and expanding dataset. The longer we measure, the more extremes we will observe.
The current event aligns with a well-understood atmospheric configuration. A strong ridge has developed over the western United States, coinciding with a transition from La Niña toward El Niño conditions and warmer-than-average coastal waters in the eastern Pacific. These are classic drivers of regional heat events. They have operated in the past, and they will continue to operate in the future.
Historical Context Cannot Be Ignored
The most severe heatwaves in United States history still occur in the early twentieth century, particularly during the nineteen thirties. As discussed in my prior work, Heat waves show no correlation with atmospheric GHG concentrations or emissions, the Dust Bowl era remains the benchmark for extreme heat in the observational record. These events occurred when atmospheric carbon dioxide concentrations were far lower than today.
This is not a minor detail. It is central to the discussion. Any claim that modern heat events are fundamentally different must reconcile with the fact that more extreme events occurred under very different climatic conditions.
Attribution Claims Are Overstated
We are increasingly told that events like this would not have been possible without human influence. That claim is presented with a level of certainty that is not reflected in the underlying science.
Attribution studies do not observe reality. They simulate it. They compare model-generated worlds with and without human emissions and then assign probabilities to outcomes. That is not a direct measurement. It is an inference layered on many assumptions.
Measurement Matters More Than Most Realize
Another critical aspect that is often overlooked is how and where temperatures are measured. Many of the stations contributing to these records are located in environments that have changed substantially over time. Airports, expanding urban areas, and infrastructure development all introduce localized warming influences that can affect recorded temperatures.
I explore this in detail in Can We Really Trust the Global Temperature Record, where I examine how station placement, adjustments, and data processing can influence the final temperature record. When we interpret new records, we must consider not only the numbers themselves but also the context in which they are measured.
The Broader Perspective
Even in the context of a modest warming trend, it is essential to recognize that not all changes are harmful. Cold-related mortality remains significantly higher than heat-related mortality on a global scale.
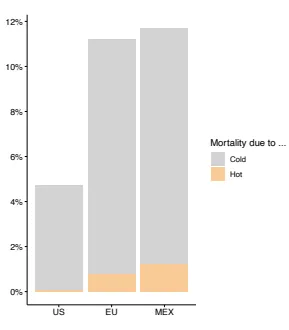
A slightly warmer world reduces exposure to extreme cold, which has historically been far more dangerous to human populations.
In The Temperature Illusion: Heat Hysteria Debunked, I discuss how these broader impacts are often overlooked in favor of a singular focus on heat extremes. A balanced assessment must consider both sides of the equation.
What This Heatwave Really Represents
This early-season heat event is real, and it is notable. It is also entirely consistent with the historical behavior of the climate system. When viewed in the context of more than a century of data across multiple states, it does not stand out as unprecedented or anomalous in any meaningful sense.
What it does reveal is how quickly individual events are framed to fit a predetermined narrative. Rather than being presented as part of a complex and variable system, they are often isolated and amplified as evidence of a singular cause.
Final Thoughts
The longer and more complete our observational record becomes, the more clearly we see that variability is the defining characteristic of climate. Extremes are not new. They are expected. Records will continue to be broken in both directions as the dataset grows.
Understanding this is essential. Without that context, it becomes far too easy to mistake normal variability for something extraordinary.
If You Want to Go Deeper
This free article was previously published on Irrational Fear.
Want more analysis like this?
On his Substack Irrational Fear, Dr. Matthew Wielicki shares data-driven climate analysis, critiques of official claims, and access to 435+ original articles.
If you prefer evidence over slogans, explore and subscribe here.

Dr. Matthew Wielicki
Earth science professor-in-exile, climate and cultural realist, political orphan, pluralist, husband, father, friend, optimist, Irrational Fear Substack. Dr Matthew Wielicki also appears in the documentary Climate: The Movie on Clintel’s YouTube channel.

more news
Václav Klaus: Should We – and Eventually Can We – Do Anything about Climate?
Should We – and Eventually Can We – Do Anything about Climate? Václav Klaus, former president of the Czech Republic, and a prominent signatory of the Clintel World Climate Declaration, recently gave a talk at the 34th Economic Forum Karpacz in Poland in a session titled “Climate Change– a Shared Responsibility”. Klaus said: [...]

On Truth and Freedom
On Truth and Freedom A personal note explaining my general stance on science. Demetris Koutsoyiannis Date: 9 September 2025 The revolutionary relationship between truth and freedom was perhaps most clearly formulated by Jesus Christ: [...]
Contrarians vs Compliers
Contrarians vs Compliers "Science - In Short" and "Who's Who in the US DOE Climate Science Report?" are two new video offerings from Friends of Science Society, meant to complement the nuanced "no climate emergency" report with additional plain language resources for the public. A rebuttal report by Dessler et al fills [...]

