The greenhouse effect, summary of the Happer and Van Wijngaarden paper
This post was updated 9/24/2021 to reflect reader comments.
The phrase “greenhouse effect,” often abbreviated as “GHE,” is very ambiguous. It applies to Earth’s surface temperature, and has never been observed or measured, only modeled. To make matters worse, it has numerous possible components, and the relative contributions of the possible components are unknown. Basic physics suggests that Earth’s surface is warmer than it would be with a transparent atmosphere, that is no greenhouse gases (GHGs), clouds, or oceans. If we assume Earth is a blackbody, then subtract the solar energy reflected, from the hypothetically non-existent clouds, atmosphere, land, ice, and oceans; we can calculate a surface temperature of 254K or -19°C. The actual average temperature today is about 288.7K or roughly 15.5°C. This modeled difference of 35°C is often called the overall greenhouse effect.
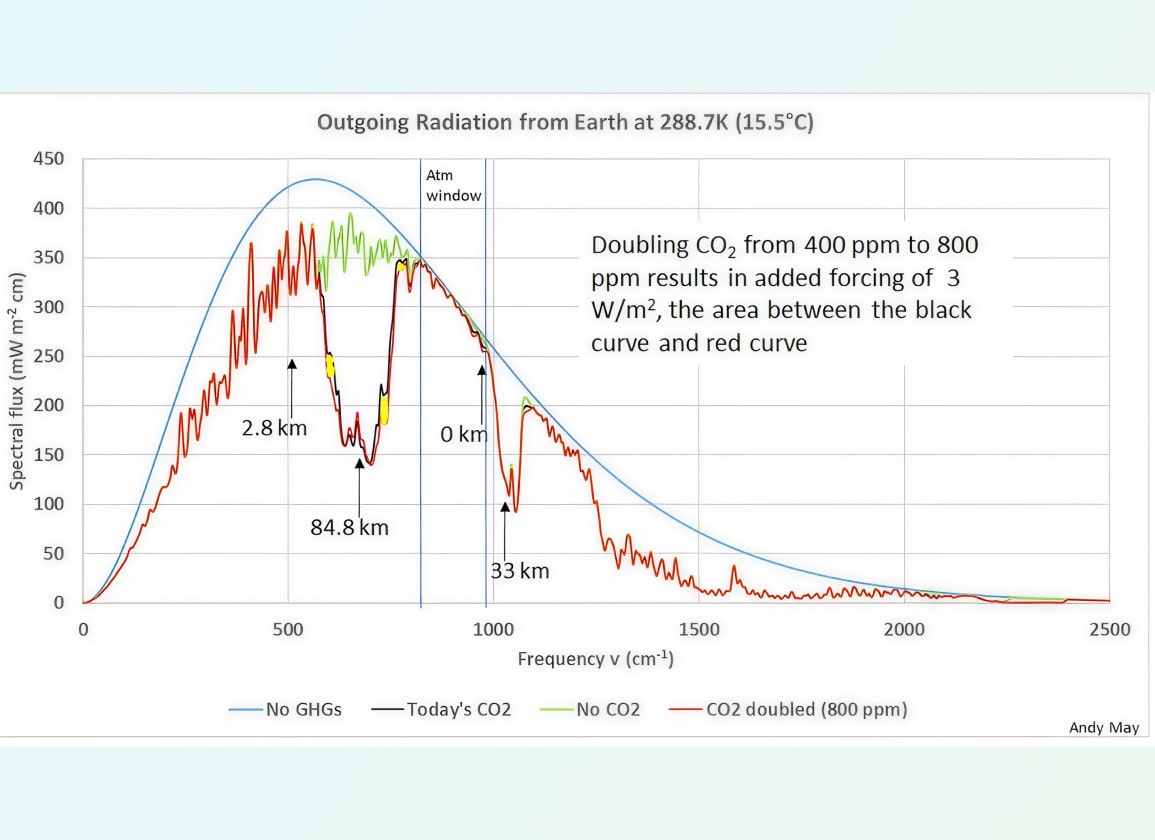
Figure 1. The computed outgoing radiation flux spectrum from Earth, with a temperature of 288.7K. The red, green and black curves are the emitted radiation as modified by CO2 (in various concentrations) and H2O, O3, CH4, and N2O, the main GHGs, in their present concentrations. The blue curve is the flux with no GHGs in the atmosphere. The black curve represents the flux with 400 ppm CO2, today’s concentration. The green is with no CO2 at all, and the red is with CO2 doubled (800 ppm). The x axis is frequency in wavenumber units and the flux is in (mW cm)/m2. The additional forcing caused by doubling CO2, is the integrated area of the distance between the black line and the red line, the major differences are highlighted in yellow. The rest of the figure is explained in the text. The data used is from HITRAN and the figure is very similar to Figure 4 in (Wijngaarden & Happer, 2020).
Clintel Foundation
Date: 22 September 2021
A blackbody is usually defined as a perfectly black cavity kept at a constant temperature. All energy that enters the cavity is absorbed by the cavity walls, and they emit exactly the same amount of energy, but the wavelength of the emitted radiation is not the same as the energy captured. Instead, the emitted radiation has a wavelength determined by the cavity temperature, which is held constant. The Earth is nothing like this. It isn’t black and both the atmosphere and the oceans absorb and redistribute solar energy, often the absorbed energy is circulated for a long time, even centuries or millennia, before it is reemitted. A blackbody absorbs and reemits energy with a delay of less than a second. Earth’s surface temperature is not constant, like a blackbody’s temperature, it varies a lot by latitude, altitude, season, and/or ocean depth. The Moon has a calculated blackbody temperature of 270K, no atmosphere or oceans, and an average temperature, at the equator and low latitudes, of around 215K, so even the Moon is not an ideal blackbody.
Some unknown portion of the overall GHE is probably due to atmospheric greenhouse gases (GHGs). These include, CO2, H2O, CH4, N2O, and O3. Dr. William Wijngaarden and Dr. Will Happer examine the likely influence of these greenhouse gases using the HITRAN line-by-line molecular transmission and absorption database maintained at Harvard University (Wijngaarden & Happer, 2020). We discuss Wijngaarden and Happer’s important paper in this post and refer to it as W&H. HITRAN stands for high-resolution transmission molecular absorption. The database compiles spectroscopic parameters that computer programmers can use to model the transmission and emission of light in the atmosphere. W&H use the database to model a hypothetical mid-latitude temperature and GHG atmospheric profile to derive a representative climate sensitivity to doubling the gases. We have previously written about the GHE and will not cover the same ground in this post, which is mostly about the W&H model.
Dr. Clive Best also studied the HITRAN database, but just for CO2 (Best, 2013). Best also investigated the effect of gravity or air pressure on Earth’s surface temperature and concluded that they must contribute something to the overall greenhouse effect but was unable to model the amount. According to the second law of thermodynamics, a thermally isolated atmosphere will reach a constant temperature throughout its height if entropy remains constant. For a closed system that does not exchange heat or work with the surroundings, entropy can only increase. Earth’s atmosphere is not closed, since it is being heated by the Sun and losing heat by radiating to space.
Also, gravity does positive and negative work on the atmosphere, it does positive work on air parcels that sink. The work causes their temperature to rise and it can cause their entropy to reduce. But, since reducing entropy means taking heat out of the system, a cooling effect, which is stronger? This constant battle of contradictory forces keeps the entropy per kilogram of air approximately constant in the troposphere. The entropy of the stratosphere increases with altitude due to warming by ozone and stronger ultraviolet radiation than the troposphere receives. As temperature increases, entropy increases and radiation emissions from the GHGs increase. The overall proportions of surface warming due to GHGs, and gravity-induced warming, if any, remains unknown.
As far as recent—past 120 years or so—warming is concerned, gravity has not changed. However, the CO2 added to the atmosphere has increased the surface pressure slightly, since CO2 is 50% denser than dry air. Measurements suggest that the total water vapor in the atmosphere has decreased slightly, but these measurements are disputed due to the quality of the instruments used. Water vapor is 40% less dense than dry air, so how much the surface air pressure has changed due to differences in these two important molecules is unknown.
In this post we will ignore the effects of gravity and surface air pressure, even though gravity causes the Sun to fuse hydrogen into helium and emit the sunlight that warms our planet. Trying to figure out how much gravity contributes to the overall GHE, and recent warming only gives me a headache, and it creates furious arguments in the comments. The reason for the furious arguments, and my headaches, is that it is a complicated thermodynamic argument, and no one really understands thermodynamics. So, we just acknowledge it must have some effect on the total GHE and leave it at that.
Gravity has no direct effect on radiation transfer, but since gravity determines how the air pressure changes with altitude, there is an indirect effect because the air pressure influences the density of greenhouse-gas molecules. Thus, it also has a large effect on their total capture cross sections that contribute to the opacity of the atmosphere. For cloud-free air, the radiation flux is determined by only two quantities, how the opacity of the atmosphere varies with altitude and how the temperature varies with altitude. W&H took the altitude profiles of both temperature and opacity from experimental observations. The HITRAN data is based on observations. It is not theoretical data.
Because Earth’s atmosphere is transparent to most solar radiation and the Earth’s surface is opaque, the surface absorbs twice as much radiation as the atmosphere. Per the laws of thermodynamics, a planet tries to emit as much radiation as it receives. If Earth emits more, it warms; if it emits less, it cools. The global average temperature of Earth varies about three degrees every year, it is just over 12 degrees in January and just under 16 degrees in July. The Earth’s temperature controls the type of radiation it emits, and it emits mostly in the thermal infrared. The range of emitted frequencies, plotted as wavenumbers, with units of 1/cm, are shown in Figure 1.
Figure 1. The computed outgoing radiation flux spectrum from Earth, with a temperature of 288.7K. The red, green and black curves are the emitted radiation as modified by CO2 (in various concentrations) and H2O, O3, CH4, and N2O, the main GHGs, in their present concentrations. The blue curve is the flux with no GHGs in the atmosphere. The black curve represents the flux with 400 ppm CO2, today’s concentration. The green is with no CO2 at all, and the red is with CO2 doubled (800 ppm). The x axis is frequency in wavenumber units and the flux is in (mW cm)/m2. The additional forcing caused by doubling CO2, is the integrated area of the distance between the black line and the red line, the major differences are highlighted in yellow. The rest of the figure is explained in the text. The data used is from HITRAN and the figure is very similar to Figure 4 in (Wijngaarden & Happer, 2020).
Both the frequency and the power emitted by molecules are determined by the molecule’s temperature. In Figure 1, if the atmosphere is transparent and contains no infrared absorbing molecules, like CO2, the 288.7K emission spectrum would look like the blue curve. The y axis in Figure 1 is the spectral flux, or the amount of energy passing through the top of the atmosphere per unit frequency, in this case frequency is expressed as a wavenumber, or the number of waves per cm. Mathematically, ѵ (frequency) is the inverse of the wavelength.
A perfectly transparent atmosphere would radiate all surface emitted energy according to the blue line in Figure 1. All the curves plotted overlay in the atmospheric window (“Atm window”) from 824 to 975 cm-1. In this window the surface radiation can go straight to space, so it is labeled 0 km. This means the emission temperature (as determined from the spectral flux) reflects the modeled surface temperature of 288.7K or 15.5°C. Other example departures from the ideal Planck brightness blue curve, are labeled with the approximate altitude of the emissions, based on their brightness temperature. At these locations the atmosphere below these altitudes can be considered opaque to surface radiation due to the combination of GHGs modeled.
The green curve is the computed spectrum with all the greenhouses gases present, in their current concentrations, except for CO2. The black and red lines are the computed energy flux for CO2 concentrations of 400 ppm and 800 ppm respectively. The area difference between the green line and the black line is representative of the CO2-caused warming from zero CO2 to today’s concentration of 400 ppm. The area difference between 400 and 800 ppm, is much smaller and will result in much less warming.
The marked altitude of 84.8 km, in the middle of the CO2 caused divot in the energy curve, means that the emissions at that frequency range, roughly 609 to 800 cm-1, come from that altitude. Below that altitude, CO2 blocks the radiation at those frequencies. In this critical CO2 region of the spectrum, CO2 is saturated and cannot block anymore radiation. 84.8 km is nearly the top of the atmosphere, very high in the mesosphere. Additional CO2 makes the divot a little wider though, as the red curve illustrates and the widening causes a bit more radiation at the edges of the enlarged divot to be blocked.
As CO2 doubles from today’s concentration, the radiation emission level moves upward at all altitudes. As it moves upward in the troposphere, if cloud cover does not change, the emission temperature decreases, and the amount of energy emitted decreases. Since less energy is emitted to space, Earth’s surface should warm. When the sky is clear, radiation fluxes can be calculated accurately, but the conversion to a temperature change can get complicated. Emission height is strongly dependent upon frequency, as Figure 1 shows, and an average emission height has little meaning, just as a global average temperature has little practical meaning.
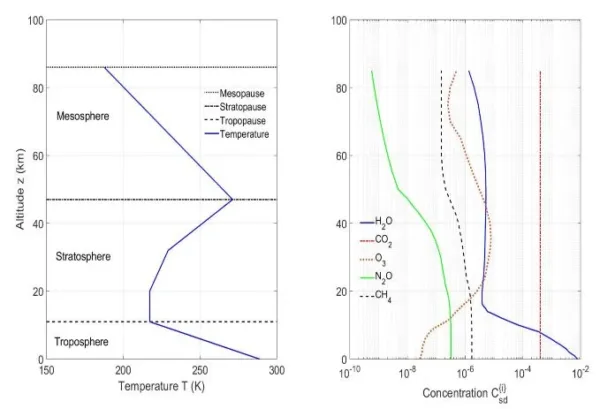
But at higher altitudes, in the middle stratosphere, temperature begins to warm with altitude. The warming is due to an increase in ozone (O3) as shown by the dotted red line in the right-hand graph of Figure 2. The increase in unattenuated solar ultraviolet light with altitude also has a warming effect. This means as the emission moves higher, more energy is emitted. This results in cooling, and we see this effect at the bottom of the CO2 divot in Figure 1. The red and the black curves reverse their positions and adding CO2 causes cooling. The reason why is illustrated in Figure 2.
Figure 2. The atmospheric temperature and GHG concentration profiles used by W&H in their emissions model. CO2 is a very stable molecule and is present in about the same concentration at all altitudes, the other GHGs vary in concentration with altitude. Source: (Wijngaarden & Happer, 2020).
The left graph in Figure 2 shows the atmospheric temperature profile used for the W&H model. In the real world, the temperature profile varies a lot from location to location and with time, especially in the troposphere, but W&H use a single set of values that are representative of the “standard atmosphere” in the mid-latitudes for their model.
There is very little H2O above the tropopause and N2O and CH4, already minor greenhouse gases in the troposphere, also decrease. In the stratosphere ozone (O3) warming is dominant and temperature increases, until the mesosphere is reached where ozone decreases rapidly and CO2 cooling begins to dominate. At the top of the mesosphere, roughly 86 km, changes in the energy flux are negligible, so W&H call this the top of the atmosphere or TOA.
Convection is minimal above the tropopause, but in the troposphere, it provides about half of the total heat transfer from the surface to the tropopause. As Figure 1 shows, except for the atmospheric window, the lower troposphere (below 2.8 km) is opaque to Earth’s OLR, or outgoing longwave (infrared) radiation, except in the IR window. The evaporation of water transports much of the surface emitted thermal energy, as latent heat, to higher altitudes where it can be radiated away from Earth. Thermal energy emissions, released from condensing water vapor, begin to appear at the base of low-level clouds, and continue throughout the cloud. Clouds are a very important component of Earth’s cooling system but cannot currently be modeled, so they are not included in the W&H model.
Clouds are included in the IPCC general circulation models (GCMs), but the IPCC assumes the cloud parameters and impact, they cannot calculate them. The IPCC AR6 report acknowledges that “clouds remain the largest contribution to overall uncertainty in climate feedbacks (high confidence).” (IPCC, 2021, pp. TS-59). While researchers are trying to model clouds, we share their high confidence that clouds are the largest source of uncertainty in computing the impact of humans on climate change.
The W&H emissions model is a clear sky model and only accurate above the clouds and in areas where there are few clouds, such as the poles and over deserts. Clouds excluded, W&H do try and account for GHG warming feedbacks. They investigated three cases, fixed relative humidity with a constant tropospheric lapse rate, fixed relative humidity with a variable lapse rate, and fixed absolute humidity. The resulting climate sensitivity values are shown in Table 1.
Table 1. The W&H modeled climate sensitivity values for three scenarios.
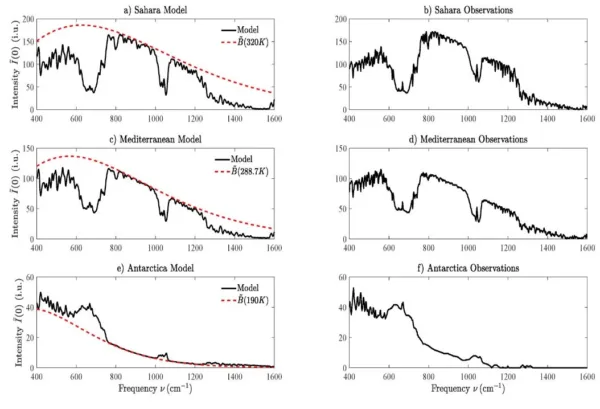
W&H also compared their resulting emissions calculations for three specific areas, the Sahara Desert, the Mediterranean and Antarctica. The comparison is shown in Figure 3.
Figure 3. The W&H models on the left, compared to satellite measurements on the right. The modeled values are very similar to the measurements. Source: (Wijngaarden & Happer, 2020).
The intensity values plotted in Figure 3 are different than the spectral flux values given in Figure 1 by 1/pi. The spectral flux values are energy passing an elevation in all directions, the values in Figure 3 are for brightness or intensity measured by a satellite. The difference is just in the units, they both measure emissions from Earth. The red Planck brightness curves in the left graphs are characteristic surface temperatures for the locations indicated, 320K (47°C) for the Sahara Desert, 288.7K (15.5°C) for the Mediterranean, and 190K (-83°C) for Antarctica. Notice the CO2 and H2O emission temperatures in Antarctica are warmer than the surface in the atmospheric window, this means the air above the ground is warmer than the ground and that the GHGs are cooling, not warming the air.
Summary and Conclusions
In summary, W&H have provided us with a detailed and accurate emissions model that shows only modest warming (2.2 to 2.3°C), inclusive of likely water vapor feedback, but not counting the feedback due to cloudiness changes. Both the magnitude and sign of net cloud feedback to surface warming are unknown. Lindzen has shown it is likely negative (cooling) in the tropics, but outside the tropics no one knows.
The water vapor feedback to surface warming is also very unclear, Ferenc Miskolczi (2014) has written:
“As long as the Earth has unlimited water supply (in the oceans) with its three phases permanently present in the atmosphere and two phases on the ground surface, the stability of the planetary climate will be controlled by the equations [see paper, page 19]. These two equations, together with the Clausius-Clapeyron equation, will regulate the transfer of the latent heat through the boundary layer in such a way that the net amount maintains the planetary radiative balance.” (Miskolczi, 2014).
Miskolczi, and others have found that total water vapor in the atmosphere has gone down in the past 70 years, although this is questioned. The work by W&M on radiation emissions suggests that future warming due to GHGs will be modest. Speculation about the warming feedback due to clouds and changes in total water vapor is just that, speculation.
The results of the study are summarized in Table 2.
Table 2. Modeled parameters for each GHG in the W&H study. The current flux at 11 km and 86 km for each GHG are shown, then the values if they are doubled, and removed from the atmosphere, and finally the percentage change in forcing (W/m2) if the current concentration is doubled. Only CO2, H2O and O3 change significantly when doubled.
Table 2 shows that the main GHGs are CO2, H2O and O3, doubling the methane or N2O concentration changes the outgoing forcing by less than one percent. Due to the properties of water vapor, its atmospheric concentration is very unlikely to double, but if it did, it would only increase the forcing by eight percent at 11 km. Doubling CO2 only increases the forcing by four percent at 11 km.
The combined current 11 km and 86 km forcing values in the table are not the sum of the individual values due to overlap. It is very clear from this table that all GHGs are saturated and adding to the current concentrations will make very little difference. Doubling CO2 will cause the stratosphere to cool about 10°C, but the changes in surface temperatures from this model are all less than 2.3°C, as shown in Table 1. This is much less than the preferred IPCC AR6 value of 3°C (IPCC, 2021, pp. TS-57). Considering that the current net effect of clouds is cooling and it seems likely that total water vapor in the atmosphere is decreasing or staying flat, these results suggest we have little to worry about regarding increasing GHGs.
Download the bibliography here.

Biography
Andy May is a writer, blogger, and author living in The Woodlands, Texas; and enjoys golf and traveling in his spare time. He is the author of two books on climate change issues and one on Kansas history. Andy is the author or co-author of seven peer-reviewed papers on various geological, engineering and petrophysical topics. He retired from a 42-year career in petrophysics in 2016. You can find many of his posts on the popular climate change blog Wattsupwiththat.com, where he is an editor. His personal blog is andymaypetrophysicist.com.
more news
Sacré bleu! Macron blames renewables for Spain’s blackouts, France drops renewables targets, expands nuclear
Europe’s energy debate is shifting. After Spain’s major blackout, even long-time advocates of aggressive renewable targets are questioning whether power systems can rely so heavily on wind and solar without sacrificing stability.
Right, New York Times, Scientists Do Disagree on The Polar Vortex
A recent New York Times article explores claims that climate change may be worsening winter cold extremes. While some scientists argue that Arctic warming destabilizes the polar vortex, long-term data show a clear decline in extreme cold events, challenging that narrative.
The Endangerment Finding Was Pre-Cooked
In this analysis, Dr. Matthew Wielicki examines the EPA’s 2009 Endangerment Finding, contending that the ruling was effectively decided in advance and later justified through a structured scientific review, with far-reaching consequences for climate regulation.
