Dr. Matthew Wielicki: The Weather Stations We Never Had
How sparse thermometers and generous infilling built a global temperature story.

A central pillar of the climate-crisis narrative is simple enough to fit on a bumper sticker… today is the hottest in human history. That line only works if you accept, without question, that we have reliable, global temperature data before satellites. We do not. What we have is a patchwork of land stations concentrated in a few developed regions, a lot of ocean guesses from ship tracks, and then, later, generous statistical infilling.
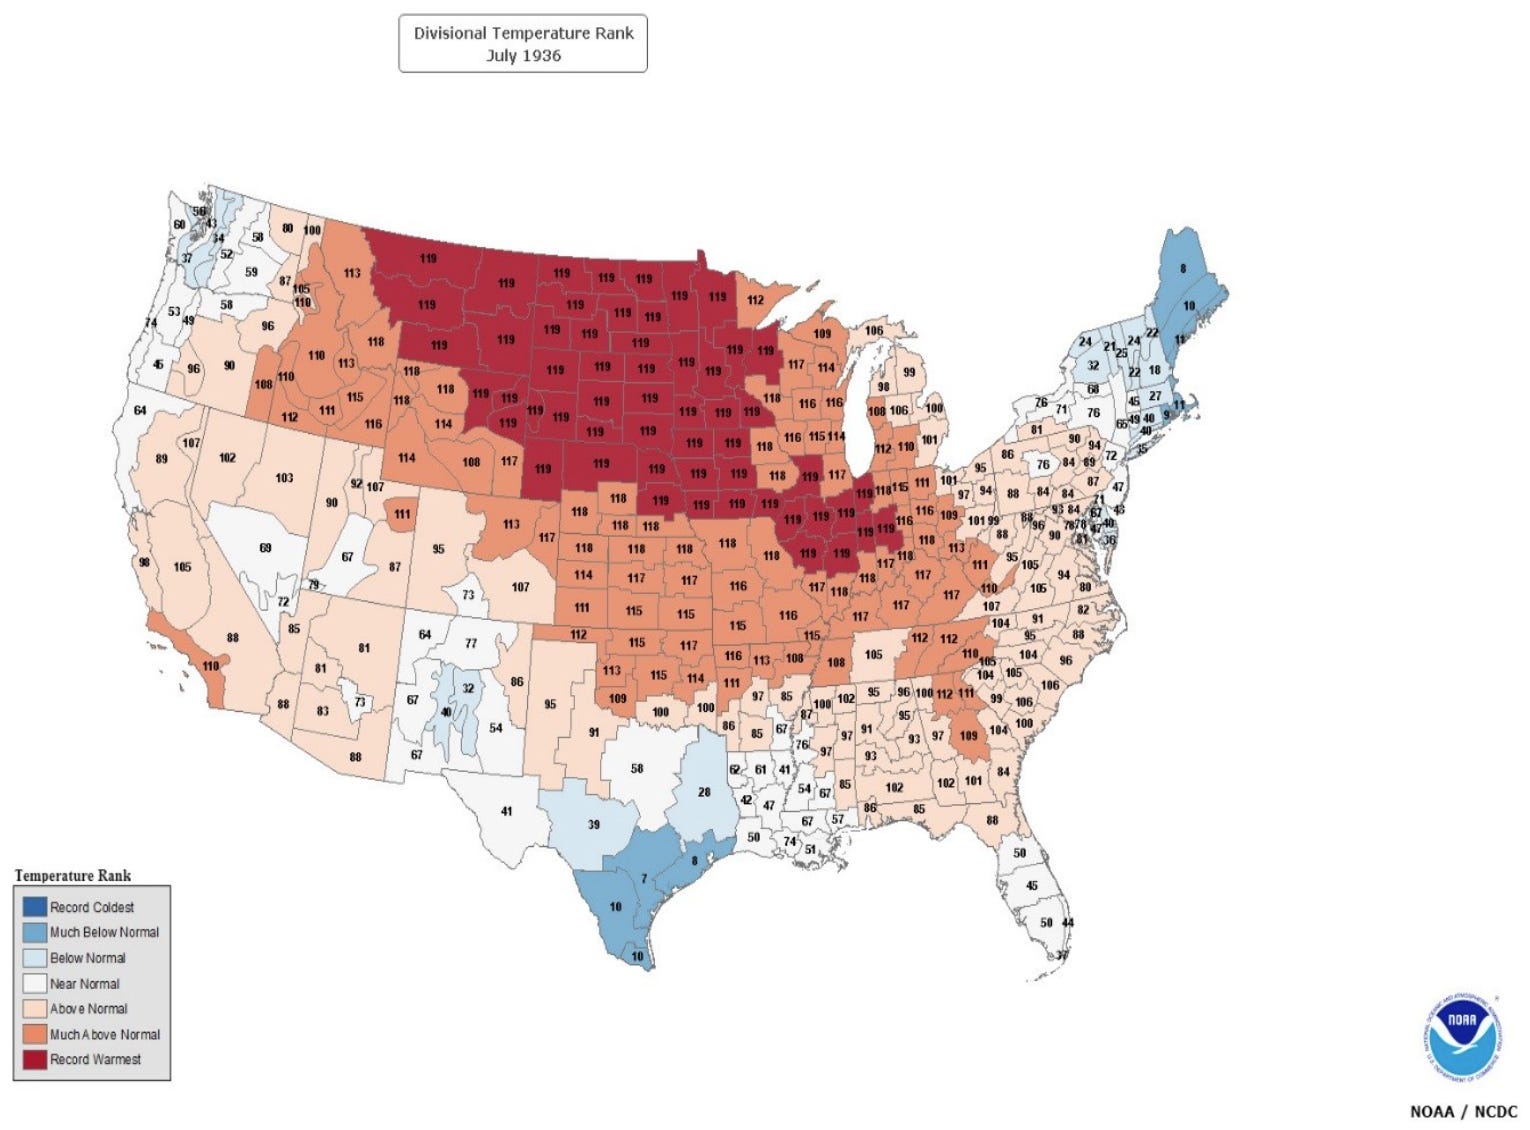
Everyone agrees the 1930s were brutally hot across the United States… the Dust Bowl was a humanitarian and ecological disaster. Crops failed, soils blew away, and heat waves killed thousands. NOAA’s own retrospectives still call out 1936 as a benchmark summer, and July 1936 remains a singular month in the U.S. record.
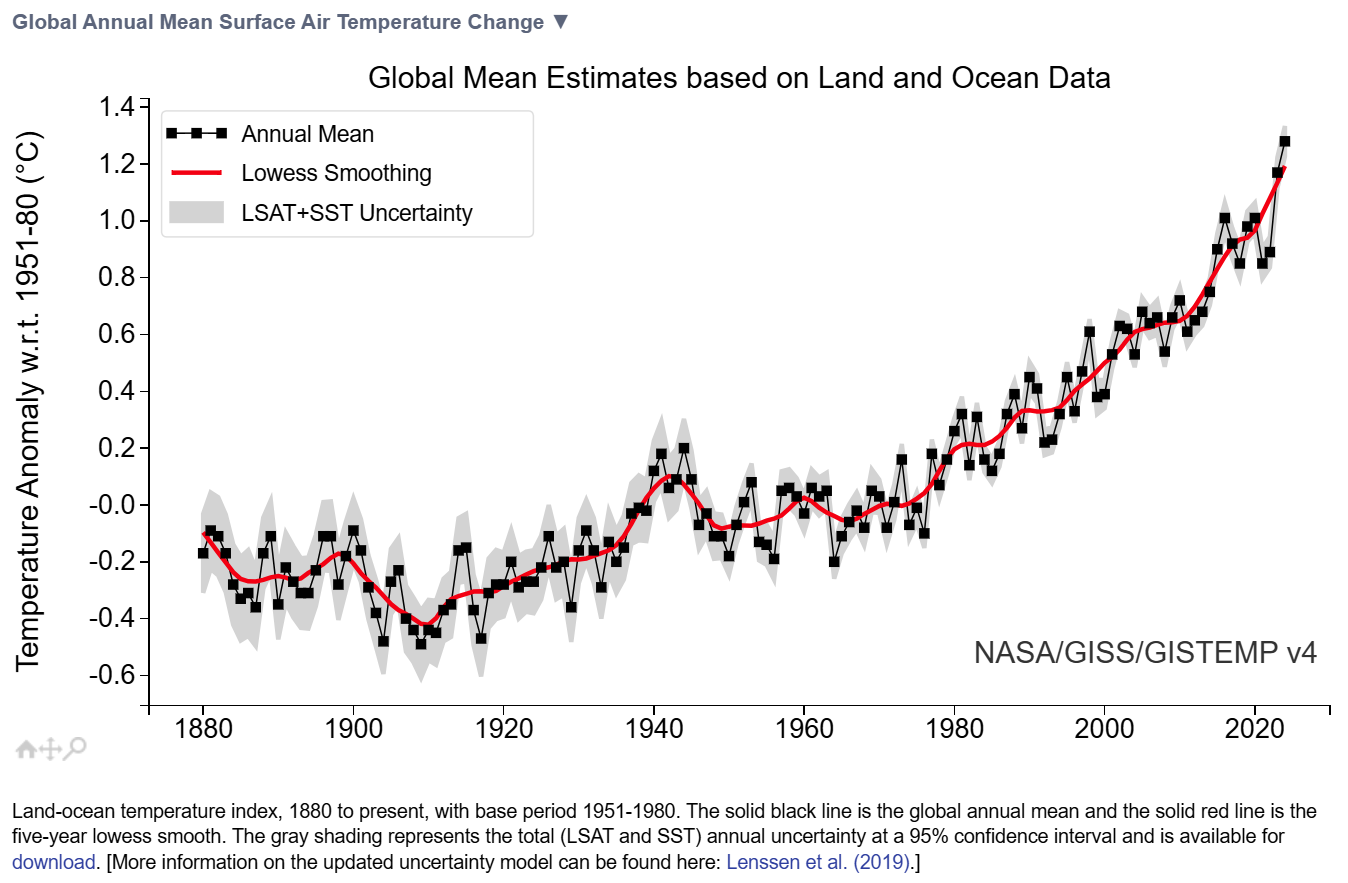
Atmospheric CO₂ at that time was roughly 310 PPM, a level derived from ice core records and widely used in NASA’s GISS datasets.
So the story we are told goes like this… yes, the U.S. was scorched in the 1930s, but the world was cooler, and only in the modern era did global temperatures rise everywhere. That story depends less on observations and more on algorithms.
The global map we never measured
Now the uncomfortable part. When there are no thermometers, you either leave grid boxes blank, or you paint numbers in from far away. HadCRUT historically left many boxes blank, explicitly avoiding interpolation, which means the “global” mean depends on where you have observations. NASA’s GISTEMP goes the other direction and spreads anomalies up to twelve hundred kilometers from a station, filling the gaps with 1200 km smoothing. Those are not trivial choices, they are the ballgame.
If you overlay the 1930s anomaly map with the station density maps, you see something obvious… warm where the thermometers were numerous, cool or neutral where coverage was threadbare. A compilation of historical station distribution between 1921 and 1950 makes the same basic point… the network was sparse and badly unbalanced.
Today’s “records,” the jet-exhaust problem
If you want to read more you have to subscribe to Irrational Fear

Dr. Matthew Wielicki
This article was published on 9 August 2025 by Dr Matthew Wielicki on his website Irrational Fear.
By subscribing you can unlock the full breakdown, plus get access to more than 380 deep-dive pieces that dismantle the pillars of the climate crisis narrative.


more news

Press release GWPF: Event Attribution Studies are “a blot on science”, says Ralph B. Alexander
Extreme weather attribution studies are based on flawed logic and misleading statistical practices, according to a new report by The Global Warming Policy Foundation (GWPF). Author Ralph B. Alexander argues that these studies, which link individual weather events to climate change, are driven more by political and legal agendas than by robust scientific evidence.

China’s Massive Coal-to-Liquids Expansion
In this article, Australian science writer Jo Nova examines China’s rapidly expanding coal-to-chemicals and coal-to-liquids industry. While much of the West focuses on phasing out fossil fuels, China is quietly transforming coal into fuels, plastics and fertilizers at massive scale—raising important questions about energy security and global climate policy.
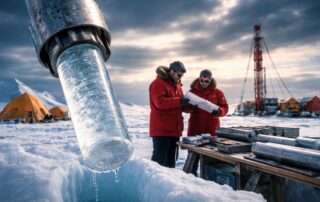
New Ice Core Study Finds No Clear CO₂–Temperature Link
New research from ancient Antarctic ice cores is challenging long-held assumptions about the role of carbon dioxide in Earth’s climate history. Evidence suggests that CO₂ and methane levels remained remarkably stable over millions of years—even as the planet experienced dramatic temperature shifts. These findings raise fresh questions about the extent to which greenhouse gases alone can explain past and present climate change.

