Holocene CO2 and the earlier IPCC Reports
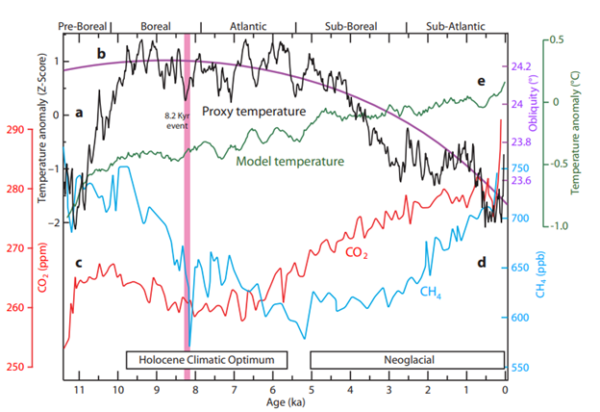
As I noted in my earlier post, “The IPCC AR6 Report Erases the Holocene,” the IPCC does not like to discuss the correlation between CO2 and temperature during the Holocene. It destroys their hypothesis that greenhouse gases and volcanos control Earth’s climate. Below is Javier’s plot of reconstructed Holocene temperatures, CO2 concentrations, methane concentration, and IPCC/CMIP climate modeled temperature. The plot is from Javier’s book, page 49.
Figure 1. Plot of CO2 (red line), CH4 (blue line), IPCC climate model calculated temperature (green line), and proxy temperature (as Z-score, black line) for the Holocene. The CO2 record shown is from Dome C in Antarctica. The methane (CH4) record shown is from Greenland (Kobashi, Severinghaus, Brook, Barnola, & Grachev, 2007). Source: (Vinós, 2022, p. 49)
Clintel Foundation
Date: 24 February 2023
As figure 1 makes clear, CO2 and methane (CH4) move opposite of temperature for almost the entire Holocene Epoch. As a result, the climate models compute a global temperature that increases steadily during the Neoglacial Period (~5,000 years ago until the end of the Little Ice Age around 1850AD), while proxy temperatures declined. The proxy temperature curve shown is presented as a “Z-score,” basically in standard deviation units, due to a furious debate on how much actual global cooling took place between the Holocene Climatic Optimum and the Little Ice Age. Everyone has an opinion, but no one knows.
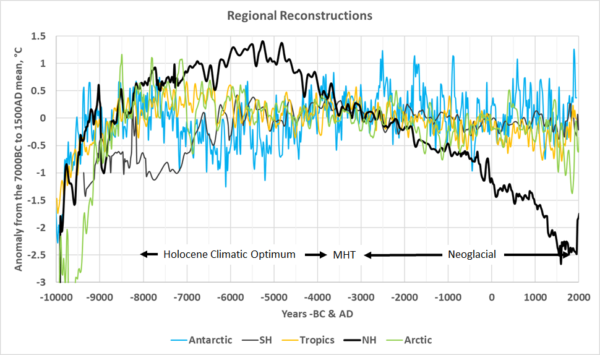
The root of the debate is that the Northern Hemisphere, where most of the proxy data came from, cooled much more than the rest of the world, as shown in figure 2.
Figure 2. The regional temperature reconstructions shown are in 30° latitude slices, that is the Arctic (green line) is from 90°N to 60°N, the Northern Hemisphere (heavy black line) is from 60°N to 30°N, the tropics are from 30°N to 30°S, the Southern Hemisphere is from 30°S to 60°S and the Antarctic from 60°S to 90°S. The Holocene Climatic Optimum warm period, the Mid-Holocene Transition (MHT), and the Neoglacial Period are identified. Sources: (May, 2018, Chapter 4) and here
Global average surface temperature (GAST) is almost a meaningless number as figure 2 makes clear. GAST hides a great deal of important detail. Over long periods of time, due to Earth’s orbit and its spin axis tilt relative to the orbital plane (aka obliquity) the Southern Hemisphere (thin black line) and the Antarctic (light blue) temperatures often move opposite the Northern Hemisphere (heavy black line) and Arctic (green line).
The angle of Earth’s axial tilt is shown in Figure 1 as a purple line. You can clearly see that the Neoglacial began as obliquity began to decline. Figure 2 shows us that the Neoglacial was predominantly a Northern Hemisphere event. The Arctic also shows a significant decline, but only since 1000AD. The Southern Hemisphere and Antarctica bounce around (up and down about 0.5°C) but do not show a significant decline or increase.
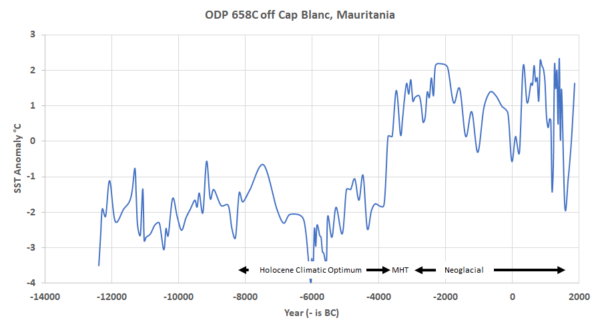
We define the Mid-Holocene Transition (MHT) as being from about 3650-3250BC. Lots of climatically significant events happened then. The most significant was a southern shift in the Intertropical Convergence Zone, or ITCZ. It shifted abruptly southward about 3900BC. The shift is observed in sea surface temperatures (SST) from seafloor core ODP-658C as described by de Menocal and colleagues in 2000. Figure 3 is a plot of the Atlantic SSTs reconstructed from this core.
Figure 3. Sea surface temperatures reconstructed from the sediments and fossils from the ODP-658C core from the Atlantic, just offshore of Mauritania
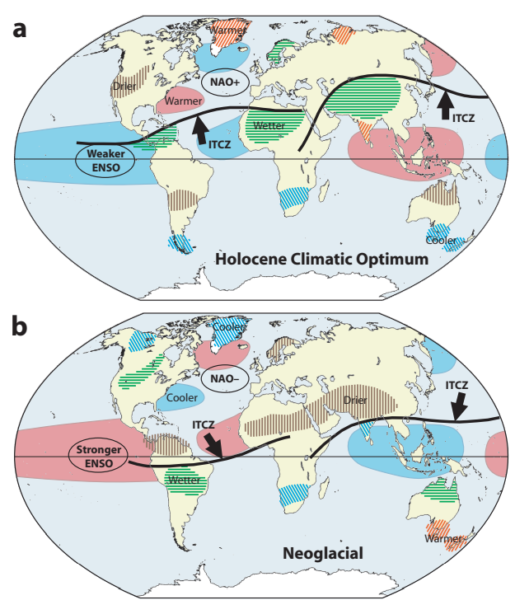
As you can see, the shift in ITCZ occurred either very early in the Mid-Holocene Transition, or just before it began. Javier provides us with maps showing the Holocene Climatic Optimum (HCO) and the Neoglacial ITCZ positions, we show his maps in figure 4.
Figure 4. Javier’s maps of the ITCZ in the HCO and in the Neoglacial. (Vinós, 2022, p 51)
A lot changed when the Holocene Climatic Optimum ended, and the Mid-Holocene Transition (MHT) began. As Javier writes in his book, on page 96, the European and North African climate went from an ideal climate for farming to a disaster by 3200BC. Failed farms were abandoned and people returned to being hunter-gatherers as the climate deteriorated. The orbital precession and obliquity driven change in the ITCZ, was accompanied by the Sumerian cluster of grand solar minima and the resulting climate changes caused a collapse in the European population. The Sahara Desert began to form, which drove people to the Nile valley where the first Egyptian Kingdoms were built on the backs of their slave labor.
The frequency of El Niños increased. They were quite rare during the HCO, but they became more common as the Northern Hemisphere cooled. Otzi the Tyrolean Iceman was killed and frozen into an advancing glacier. A large human genetic shift took place in Europe, the Chalcolithic Period transitioned to the Bronze Age, and the woolly mammoth went extinct. I refer the reader to Javier’s book for more details.
So, given all this, David Siegel noticed my previous post about the IPCC ignoring the Holocene, and asked me what the earlier IPCC reports have to say about the dramatic and well documented Holocene climate changes. We know they ignored them and their relationship with CO2 in AR6, have they always ignored them? I quickly looked through FAR and SAR, and found very little in them except they both mentioned that the Holocene climate appears to be driven by orbital forcing and the Holocene CO2 concentrations do not change much:
“…Holocene … [is not] considered [a reliable analogue] for a climate with increased concentration of greenhouse gases.”
(FAR, page 158-159).
They do not mention the possibility that their greenhouse gas hypothesis is wrong. They do acknowledge “that changes in orbital parameters alone can account for much of the changes from present climate found in the mid-Holocene.” (FAR, page 159).
In SAR, we see this:
“Large and rapid climatic changes occurred during the last ice age and during the transition towards the present Holocene period. Some of those changes may have occurred on timescales of a few decades, at least in the North Atlantic where they are best documented. They affected atmospheric and oceanic circulation and temperature, and the hydrologic cycle. … The recent (20th century) warming needs to be considered in the light of evidence that rapid climatic changes can occur naturally in the climate. However, temperatures have been far less variable during the last 10,000 years (i.e., during the Holocene).”
(SAR, p. 179).
Certainly, large, and rapid natural changes in climate can occur. No justification for the last statement in the quote is provided.
In TAR, we see the following:
“Long-term climate changes during the Holocene are consistent with the effects of orbital forcing, modified by the persistence of the Laurentide ice sheet (which finally disappeared around 6 ky BP).”
(TAR, p. 139)
And this:
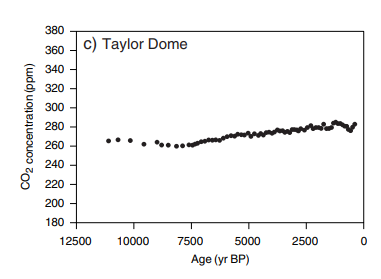
“Natural variations in CO2 during the past 11,000 years (Figure 3.2c [our figure 5]) have been small (about 20 ppm) according to the best available measurements, which are from the Taylor Dome ice core (Smith et al., 1999; Indermühle et al., 1999). These measurements show a short-lived maximum around 11 kyr BP, followed by a slight fall, which may have been caused by increasing carbon storage in the terrestrial biosphere. Atmospheric CO2 concentration was about 260 ppm at its Holocene minimum around 8 kyr BP and increased towards about 280 ppm in the pre-industrial period. The same pattern and the same CO2 concentration levels over the past 8 kyr have also been shown in another ice core, BH7 near Vostok (Peybernès et al., 2000).”
(TAR p. 203)
Figure 5. The only plot of Holocene CO2 concentration I found in any of the major IPCC reports. TAR, page 201. Notice it matches Javier’s in Figure 1
Here is where the IPCC are the most honest, which is odd because this is the report that contained the notorious and widely ridiculed “Hockey Stick.” They acknowledge that the minimum CO2 was about 6000BC near the end of the HCO and that it increases after that until the modern day, that is throughout the Neoglacial Period cooling. But they do not do the obvious, they do not slap a proxy temperature record on top of it like Javier does in Figure 1.
“In the context of both climate forcing and response, the Holocene is far better documented in terms of spatial coverage, dating and temporal resolution than previous interglacials. The evidence is clear that significant changes in climate forcing during the Holocene induced significant and complex climate responses, including long-term and abrupt changes in temperature, precipitation, monsoon dynamics and the El Niño-Southern Oscillation (ENSO). For selected periods such as the mid-Holocene, about 6 ka, intensive efforts have been dedicated to the synthesis of palaeoclimatic observations and modelling intercomparisons. Such extensive data coverage provides a sound basis to evaluate the capacity of climate models to capture the response of the climate system to the orbital forcing.”
(AR4, p. 459) (italics added)
“The evolution of atmospheric trace gases during the Holocene is well known from ice core analyses (Figure 6.4). A first decrease in atmospheric CO2 of about 7 ppm from 11 to 8 ka was followed by a 20 ppm CO2 increase until the onset of the industrial revolution (Monnin et al., 2004).”
(AR4 p. 459)
So significant and complex climate responses resulted from a 20-ppm change in CO2, if orbital forcing is taken into account. They do admit that the Holocene is far better documented than previous geological periods. It is nice that they admit that natural climate change exists and can be significant and complex.
“Simulations of past climate can be used to test a model’s response to forcings larger than those of the 20th century”
(AR5 p. 776)
Impressive! They acknowledge that forcing larger than human-emitted greenhouse gases exist and have happened in the past.
“At a regional scale, models tend to underestimate the changes in the north-south temperature gradient over Europe both at the LGM [Last Glacial Maximum] (Ramstein et al., 2007) and at the mid-Holocene (Brewer et al., 2007; Davis and Brewer, 2009”
(AR5 p. 777)
Models underestimate Holocene latitudinal temperature gradients (LTG). Considering that changes in LTGs are a primary driver of climate change, this is more significant than they probably knew at the time.
“… SST biases contribute to model-data mismatch in the simulation of the mid-Holocene Asian monsoon (Ohgaito and Abe-Ouchi, 2009), even though the representation of atmospheric processes such as convection seems to dominate the model spread in this region…”
(AR5 p. 799)
Again, changes in convection are a primary driver of climate change and so are changes in sea surface temperatures. This is a clue that the IPCC/CMIP climate models are not working.
Discussion
Throughout all the reports, significant Holocene evidence, which is “far better documented” than earlier periods, that the IPCC/CMIP models are wrong is ignored or brushed away. I’ve been pointing out that the Holocene is important for ten years now. We have reasonably accurate historical and archeological records of numerous abrupt climate events since 10,000BC. Further, all proxies for the Holocene are more accurate than they are for earlier times.
It should go without saying, but I’ll say it anyway, if you can’t explain Holocene climate changes, you can’t explain climate. Ignoring the Holocene will not make it go away.
By Andy May
Works Cited
deMenocal, P., Ortiz, J., Guilderson, T., & Sarnthein, M. (2000, July). Coherent High- and Low-Latitude Climate Variability During the Holocene Warm Period. Science, 2198-2202. Retrieved from https://www.researchgate.net/publication/12453679_Coherent_High-_and_Low-Latitude_Climate_Variability_During_the_Holocene_Warm_Period
Kobashi, T., Severinghaus, J. P., Brook, E. J., Barnola, J.-M., & Grachev, A. M. (2007). Precise timing and characterization of abrupt climate change 8200 years ago from air trapped in polar ice,. Quaternary Science Reviews, 26(9-10), 1212-1222. doi:10.1016/j.quascirev.2007.01.009
May, A. (2018). Climate Catastrophe! Science or Science Fiction? American Freedom Publications LLC. Retrieved from https://www.amazon.com/CLIMATE-CATASTROPHE-Science-Fiction-ebook/dp/B07CPHCBV1/ref=sr_1_1?ie=UTF8&qid=1535627846&sr=8-1&keywords=climate+catastrophe+science+or+science+fiction
Vinós, J. (2022). Climate of the Past, Present and Future, A Scientific Debate, 2nd Edition. Madrid: Critical Science Press. Retrieved from https://www.researchgate.net/publication/363669186_Climate_of_the_Past_Present_and_Future_A_scientific_debate_2nd_ed
more news
Challenges to the CO2 Global Warming Hypothesis: (13) Global Warming Entirely from Declining Planetary Albedo
Is the recent warming the result of less reflection of sunlight by the Earth? Two researcher state that declining albedo — not CO₂ — dominates the temperature trend.
Guardian Claims We’re Still Only Approaching the Climate Point of No Return
The Guardian claims the world is edging toward a climate “point of no return,” where unstoppable warming will lock Earth into a catastrophic “hothouse” future. Yet the geological record tells a very different story. Past periods of far higher temperatures and CO₂ levels did not end life or civilization’s prospects — they supported abundance and evolutionary expansion.
The EV experiment has become a bloodbath — $140 billion wasted — more to come
The electric vehicle push was supposed to reshape the auto industry and accelerate the energy transition. Instead, mounting losses and collapsing share prices are raising serious questions about whether governments and manufacturers misread the market. What began as a bold industrial gamble is now looking, to some critics, like one of the most expensive policy experiments in recent automotive history.
