In today’s post I wish to celebrate a booklet (Special Report) by my colleague Theano (Any) Iliopoulou and myself, which was published the other day:
T. Iliopoulou, and D. Koutsoyiannis, Have Rainfall Patterns Changed? A Global Analysis of Long-Term Rainfall Records and Re-Analysis Data, 47 pages, SR 306, The Heritage Foundation, Washington, DC, USA, 2025.
Theano is a former student of mine who did her PhD thesis on “Stochastic investigation of hydrological extremes: influence of temporal variability and dependence”, a subject related to that of the booklet.
The abstract of the booklet reads as follows:
Amid concerns of intensified water cycle during global warming, the scientific attention on rainfall dynamics and its extremes is increasing. Global trends in rainfall totals and extremes are investigated using long-term rainfall station data—spanning more than 150 years for rainfall maxima and more than 200 years for total annual totals, as well as rainfall re-analysis products—covering the entire globe. Rainfall exhibits significant interannual and multi-decadal variability, greater than that of a purely random process, yet with no systematic pattern. Regional differences are pronounced, with some regions showing increased rainfall variability and notable changes, while other regions are characterized by stability. The findings suggest that global rainfall trends and extremes do not align with a global systematic change that could be attributed to a single driver, such as rising carbon-dioxide emissions. This emphasizes the need for stochastic models rather than deterministic projections for future hydroclimatic predictions.
The Key Takeaways are:
- Rainfall shows substantial interannual variability without a global systematic pattern. Regional differences are pronounced.
- Rainfall totals have increased in Southeast Asia with concurrent decreases in East Africa, while areas, like the Mediterranean, have maintained climatic stability.
- Despite these variations, global average daily rainfall and extreme events do not exhibit systematic changes, which emphasizes the importance of stochastic modeling.
The concluding paragraph is:
Hence, this Special Report concludes that rainfall rises and falls irregularly, exhibiting pronounced temporal fluctuations and even more pronounced regional differences. As this dynamics is inherently unpredictable, it is better modeled with stochastic approaches. Notwithstanding the importance of local and regional changes for the operational water resources management and risk preparedness, such changes do not currently concur with the speculative hypothesis of a global systematic change in rainfall, nor with a worldwide intensification of its extremes that could be attributed to a single driver, such as anthropogenic greenhouse gas emissions.
I am copying below some graphs, which I think speak for themselves and illustrate the points listed above.
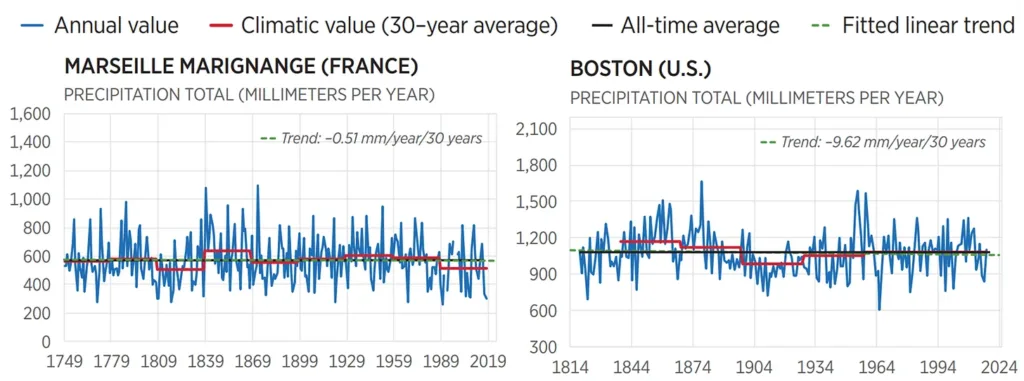
From the longest available rainfall station data series worldwide:

Chart 1 of the booklet (part): Annual total precipitation in Marseille and Boston.
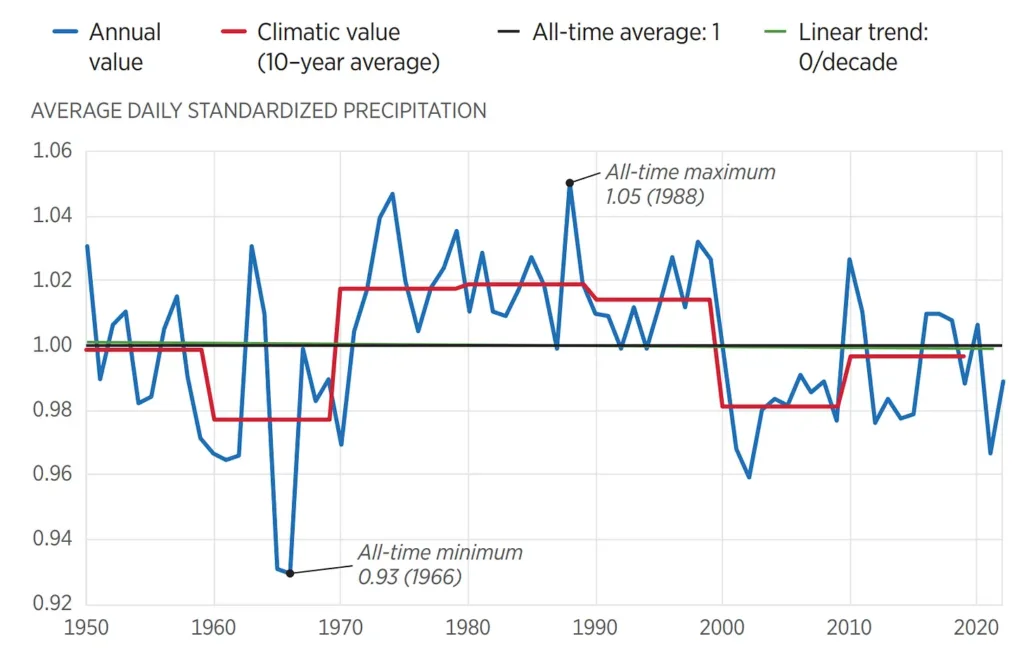
From the ERA5 global reanalysis data — average daily precipitation (the 31 subdivision of the Earth were taken from the IPCC SREX and AR5 reports):

Chart 10 of the booklet (part): Plot of the time series of annual average daily precipitation over the globe, after standardization with the all-time average precipitation of each of the 31 subdivisions, before taking the average.

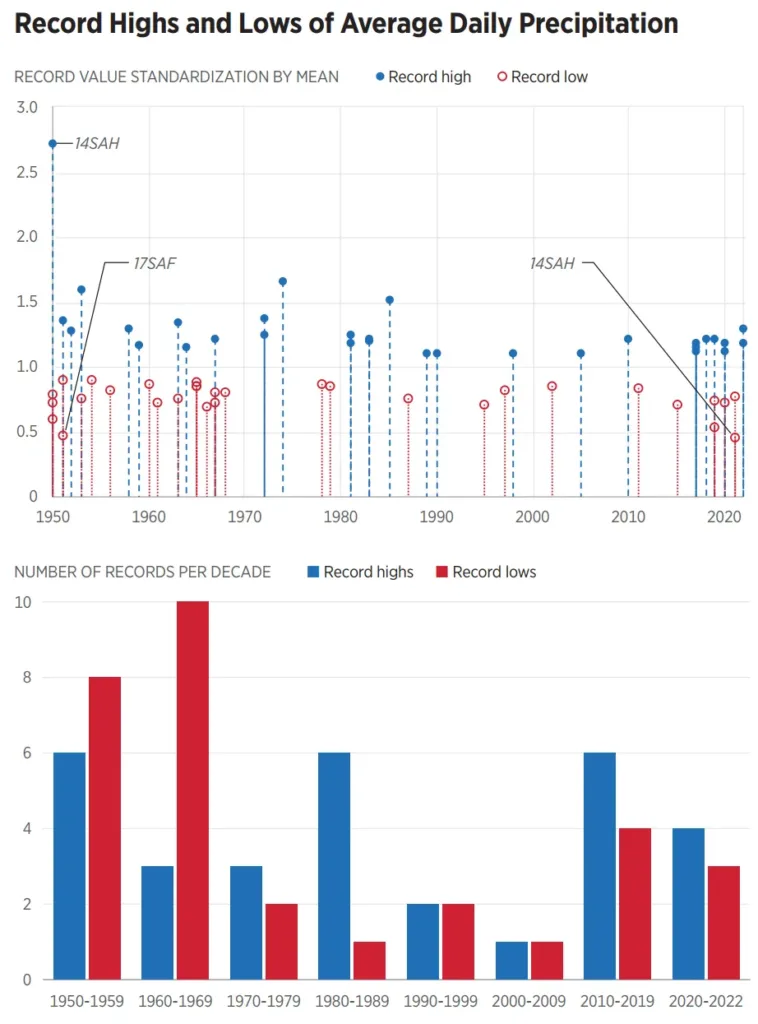
Chart 13 of the booklet: Record highs and lows of average daily precipitation depth per year, standardized by the mean (upper panel; with marking of those being higher than 2 or lower than 0.5) and number thereof per decade (lower panel) for the 31 regions of the globe. The upper and lower 95 percent confidence limits, calculated from the binomial distribution assuming independence and identical distribution, are 8 and 1, respectively, for a decade, and 4 and 1, respectively, for the three-year period 2020–2022; thus, only the record lows from 1960 to 1969 are too many, exceeding the upper confidence limit
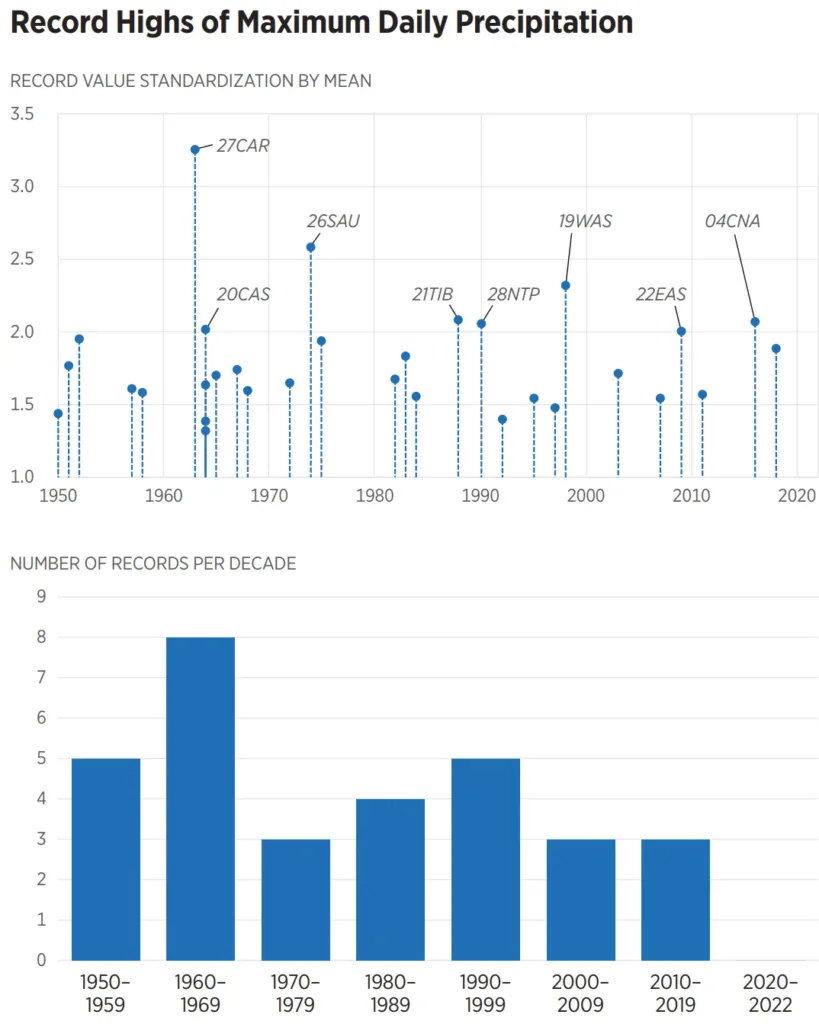
From the ERA5 global reanalysis data — maximum daily precipitation (the 31 subdivision of Earth were taken from the IPCC SREX and AR5 reports):

Chart 18 of the booklet: Record highs of maximum daily precipitation depth per year, standardized by the mean (upper panel; with marking of those being higher than 2) and number thereof per decade (lower panel) for the 31 regions of the globe. The upper and lower 95 percent confidence limits, calculated from the binomial distribution assuming independence and identical distribution, are 8 and 1, respectively, for a decade, and 4 and 1, respectively, for the three-year period 2020–2022; thus, there are no record highs outside the confidence band….
The entire booklet is in open access and the interested readers are invited to download it for perusal.
Photo on top: Shutterstock
