The IPCC AR5 report was published in 2013 and the CMIP5 climate models they used, have been shown to predict faster warming than observed in the tropical troposphere at a statistically significant level by Ross McKitrick and John Christy.[1] This problem is acknowledged and discussed in the latest AR6 report, published in 2021, but brushed aside as unimportant. In AR6, the IPCC observed:
“The AR5 assessed with low confidence that most, though not all, CMIP3 and CMIP5 models overestimated the observed warming trend in the tropical troposphere during the satellite period 1979-2012, and that a third to a half of this difference was due to an overestimate of the SST [sea surface temperature] trend during this period. Since the AR5, additional studies based on CMIP5 and CMIP6 models show that this warming bias in tropospheric temperatures remains.”
(AR6, p. 3-23)

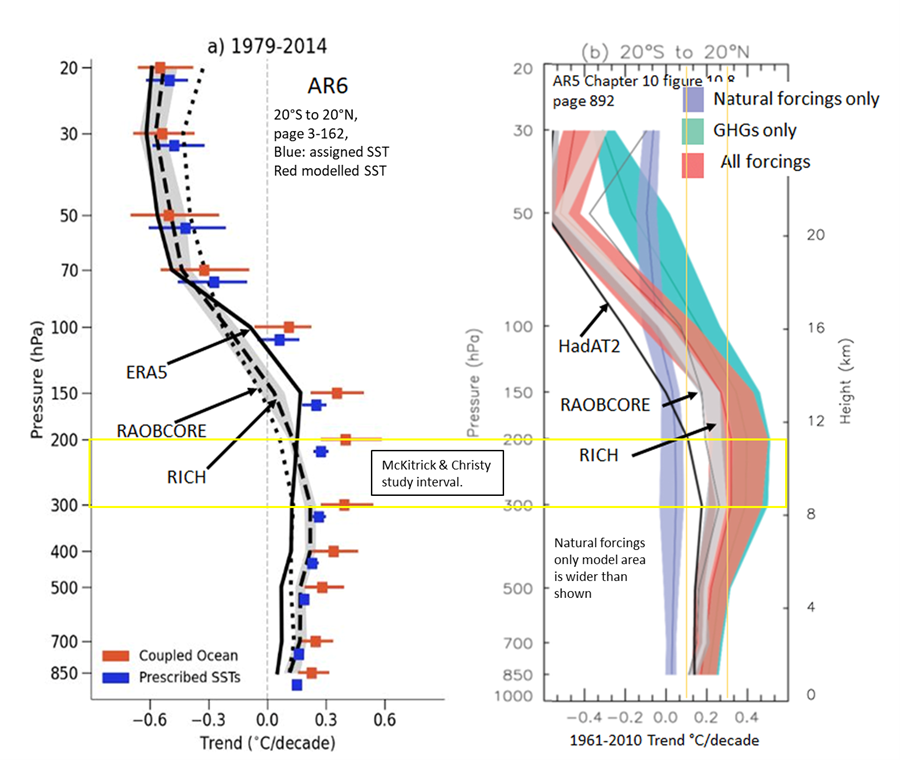
Figure 1. The AR6 tropical tropospheric temperature profile (left) compared to the AR5 profile (right). In both profiles, the observations are in black and gray and the model results are in color. The colored band width in the right plot (AR5) are the 5% to 95% model confidence intervals. In the left plot, AR6 does not define the bars, but their reference (Mitchell, et al., 2013) defines the blue and red bars as the full model range. Focus on the difference in McKitrick and Christy’s study interval (yellow box) between 300 hPa and 200 hPa. Sources: AR6, p 3-162 and AR5, p 892.
Figure 1 compares the overestimated warming in CMIP5 (AR5, right side of Figure 1) to the overestimated warming in CMIP6 (AR6, left side of Figure 1). The problem doesn’t “just remain,” it got worse. Notice the scale change in Figure 1, the AR6 scale goes over 0.6°C/decade and the AR5 scale tops out at 0.5°C/decade. In AR6 we see the average and full range of 60 models with modelled SSTs (sea surface temperatures) in red and 46 models forced to use observed SSTs in blue. The models cannot even get it right when they know what the SST is, suggesting that the models have the sensitivity to greenhouse gases wrong, or they are missing some critical climate component. Remember, the models assume that the Sun is invariant, except for the ~11-year solar cycle, and that natural variability has no pattern. Natural variability is modeled as random noise with a mean of zero climate effect.
The two graphs in Figure 1 have slightly different time periods and the observation datasets are slightly different as are the areas covered, but both are as internally consistent as possible. That is, the area covered by the observation datasets, is the same area covered by the models. I refer you to AR5, AR6, and Dann Mitchell and colleagues 2020 paper[2] for the details, or to my new book.[3]
The AR5 profile, on the right in Figure 1, colors the 5% to 95% confidence intervals of the modeled components of warming. Blue is modeled natural warming, although the blue band is too narrow, it actually extends to the red, all forcings band. The green band is the modeled greenhouse gas warming. In both figures, the observations are completely below the modeled anthropogenic warming from an altitude of 300 hPa (~30,000 feet, 9 km) to 150 hPa (~44,000 feet, 13.5 km). Most of the observations fall in the modeled “natural forcings” range, suggesting that the models overestimate greenhouse gas warming in this critical part of the atmosphere, or that the anthropogenic greenhouse warming has no significant effect.
Since 1975, when Manabe and Weatherald published their landmark climate modeling paper:[4]
“…climate models have consistently shown greater warming in the upper tropical troposphere than near the surface due to increased CO2 concentrations.”[5]
(Mitchell, Lo, Seviour, Haimberger, & Polvani, 2020)
CMIP3 models were used in the AR4 report, and when Dann Mitchell and colleagues analyzed the models, they found the models generated much higher surface temperatures than observed. Further, they found that when they used atmosphere-only models and forced the surface temperature to match observations, the overheating of the troposphere was reduced, but the temperature trend in the troposphere was still too high.[6] Basically their work shows that greenhouse gas warming is overestimated.
Mitchell’s 2013 paper[7] contains the following humorous sentence:
“The observed temperature record is one single realization of many possible realizations that could have emerged given internal climate variability.”
Mitchell, et al. (2013)
It’s not a realization Dann, it’s reality. He’s trying to say that due to possible measurement errors and known or unknown long-term natural climate variability, we are trying to model a moving target. This is true, of course, but it is what it is, and when comparing a model to reality, the differences are errors in the models, not in the measurements. Classic model-speak, I’ve said similar stupid things in my past petrophysical modeling life. Of course, there are errors in observations, and the measurement error can be estimated, but we do not know what the natural variability is, or if it is random over relevant time frames, as the modelers assume. The measurements are what they are, and our models must match them very closely if they are to be believed.
CMIP6 was published in 2021, thus, the statistically significant problem illustrated in Figure 1, has persisted for at least 46 years, and it is worse in 2021 than it was in 1975. We have spent billions of dollars and thousands, perhaps millions, of man-hours and the models are getting worse with time. Why?
The AR6 models are farther from observations than the AR5 models and are far less consistent with one another. From AR6, Chapter 7:
“On average, CMIP6 models have higher mean ECS and TCR values than the CMIP5 generation of models. They also have higher mean values and wider spreads than the assessed best estimates and very likely ranges within this Report. These higher ECS and TCR values can, in some models, be traced to changes in extra-tropical cloud feedbacks that have emerged from efforts to reduce biases in these clouds compared to satellite observations (medium confidence). The broader ECS and TCR ranges from CMIP6 also lead the models to project a range of future warming that is wider than the assessed warming range, which is based on multiple lines of evidence. However, some of the high-sensitivity CMIP6 models are less consistent with observed recent changes in global warming and with paleoclimate proxy data than models with ECS within the very likely range. Similarly, some of the low-sensitivity models are less consistent with the paleoclimate data. The CMIP models with the highest ECS and TCR values provide insights into high-risk, low-likelihood futures, which cannot be excluded based on currently-available evidence. (high confidence)”
(AR6, p. 7-8 to 7-9).
Translation from IPCC-speak: Our models have gotten worse since AR5, they also produce higher climate sensitivity to CO2 than our assumed best climate sensitivity assessment. The uncertainty in our projections of future warming has increased, and our models are not very consistent with observations or the geological past, but the models might be right anyway, so be worried. I think that pretty much captures the meaning of the quote above.
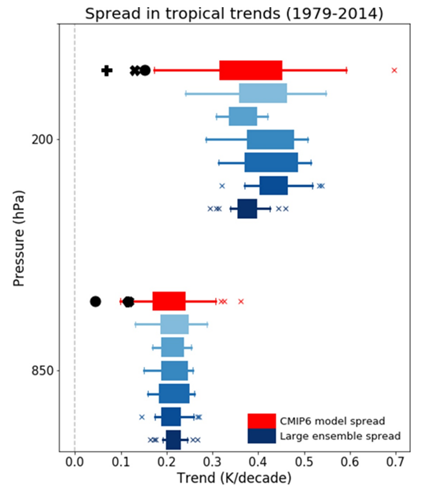
The conceptual origin of the left atmospheric profile in Figure 1 is a 2020 paper by Dann Mitchell and colleagues.[8] In that paper they present the summary graph we show as Figure 2.

Figure 2. Trends in warming, like in Figure 1, the black symbols are observations, and the colored bars are various CMIP6 model ensemble ranges. The upper set are warming trends in °C/decade for 200 hPa altitude (about 12 km) and the lower set are for 850 hPa (about 1.5 km). Source: (Mitchell, Lo, Seviour, Haimberger, & Polvani, 2020).
Mitchell, et al. point out that the difference in warming rates at 200 hPa (12 km) is a factor of about four and the difference at 850 hPa (~1.5 km) is a factor of about two. The difference is even larger at 150 hPa (~13.5 km). These are not small differences, they are huge. Notice how small the spread in observed warming rates is and that there is no overlap between the models and the observations at 200 hPa. This means there is much less than a 5% chance the models are accurate.
Conclusions
The differences strongly suggest that the models are overestimating the importance of greenhouse gases in global warming and missing important natural influences. Not surprising since the models assume that natural forces are not contributing to recent warming. Responsible modelers would recognize they are on the wrong track and abandon the Manabe and Weatherald model framework and look elsewhere. Someone once said:
“Insanity is doing the same thing over and over again and expecting different results.”
Einstein perhaps, or someone else, regardless, it is true.
One would think after six major reports, and several minor reports, all clearly wrong in the critical tropics, the IPCC would fix the problem. But, even after all this work, they can’t. Perhaps the basic framework and assumptions they are using are wrong? Is it unreasonable to say that? I don’t think so.
One hint given in the Mitchell papers stands out. The dominant cooling mechanism in the tropics is convection, this is due to the high absolute humidity there. The tropics receives more solar radiation than it radiates to space, convection carries the excess energy toward the poles. Perhaps convection is modeled incorrectly in the models? Perhaps convective heat transport from the tropics to the poles is driving climate change and being overlooked? Just a thought.
The bulk of this post is an excerpt from my latest book, The Great Climate Debate: Karoly v Happer.
The bibliography can be downloaded here.
- (McKitrick & Christy, 2018) ↑
- (Mitchell, Lo, Seviour, Haimberger, & Polvani, 2020) ↑
- (May, 2022) ↑
- (Manabe & Wetherald, 1975) ↑
- (Mitchell, Lo, Seviour, Haimberger, & Polvani, 2020) ↑
- (Mitchell, Thorne, Stott, & Gray, 2013) ↑
- (Mitchell, Thorne, Stott, & Gray, 2013) ↑
- (Mitchell, Lo, Seviour, Haimberger, & Polvani, 2020) ↑
Author

Biography
Andy May is a writer, blogger, and author living in The Woodlands, Texas; and enjoys golf and traveling in his spare time. He is the author of two books on climate change issues and one on Kansas history. Andy is the author or co-author of seven peer-reviewed papers on various geological, engineering and petrophysical topics. He retired from a 42-year career in petrophysics in 2016. You can find many of his posts on the popular climate change blog Wattsupwiththat.com, where he is an editor. His personal blog is andymaypetrophysicist.com.
