The IPCC claims, in their AR5 report, that ECS, the long-term temperature change due to doubling the atmospheric CO2 concentration or the “Equilibrium Climate Sensitivity,” likely lies between 1.5° and 4.5°C, and they provide no best estimate (IPCC, 2013, p. 85). But their average model computed ECS is 3.2°C/2xCO2. Here, “°C/2xCO2” is the temperature change due to a doubling of CO2. They also claim that it is extremely unlikely to be less than 1°C. ECS takes a long time, hundreds of years, to reach, so it is unlikely to be observed or measured in nature. A more appropriate measure of climate sensitivity is TCR, or the transient climate response, or sensitivity. TCR can be seen less than 100 years after the CO2 increase, the IPCC claims this value likely lies between 1° and 2.5°C/2xCO2, their model computed average is 1.8°C/2xCO2 (IPCC, 2013, p. 818).
The CO2 climate forcing, or the net change in radiation retained by Earth’s atmosphere associated with these scenarios is 3.7 W/m2 (IPCC, 2007b, p. 140). Using these values, we can calculate a surface air temperature sensitivity to radiative forcing (RF) of 1.8/3.7 = 0.49°C per W/m2. These values are inclusive of all model-calculated feedbacks.
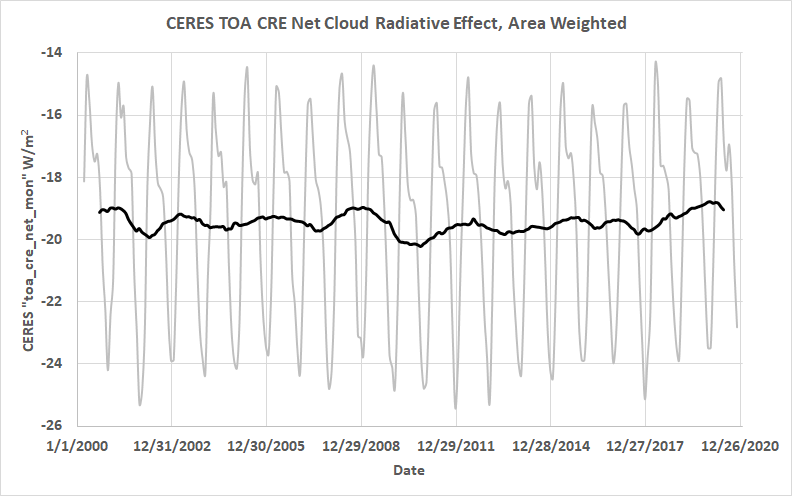
The IPCC explicitly state that they believe cloud, water vapor and albedo feedbacks are all positive and claim both model and observational evidence for this (IPCC, 2013, p. 82). They admit that cloud feedback, especially low cloud feedback, is poorly constrained and the source of most of the spread in model results (IPCC, 2013, p. 817). Cloud feedback is poorly understood; but it can offset the entire estimated human impact on climate. According to CERES satellite measurements, the net monthly RF of clouds has varies from -15 to -25 W/m2 as shown in Figure 1. Both numbers are negative, which means that overall clouds cool the earth. If the IPCC claims that doubling CO2 will increase RF about 3.7 W/m2 at Earth’s surface are true, this is less than the change in yearly cloud RF. For more on clouds and global warming, see here.
The IPCC wants us to be concerned about a CO2-caused change about 100 years from now, when we see a larger change in radiative impact every year. Their computed impact of doubling CO2 is tiny compared to natural changes. The uncertainty in the impact of CO2 on climate is the difference between two tiny numbers, both too small to measure. One might reasonably conclude they have a screw loose.

Figure 1. The global net cloud radiative impact on Earth.
It is worth repeating that the AR5 report does not provide a best estimate of ECS because of a lack of agreement in their various estimates. It is also significant that they think that TCR is extremely unlikely to be more than 3°C/2xCO2, but they do not offer a lower limit they are confident in. A summary of the IPCC estimates of ECS and TCR is presented in Box 12.2 of AR5 (IPCC, 2013, pp. 1110-1112).
There are several peer-reviewed estimates of climate sensitivity, based on observations in the real world, that are less than 1°C/2xCO2. These estimates are the focus of these posts. Some of these estimates are of ECS and some of TCR, or similar to the quantity that IPCC labels TCR. In this post we will not distinguish between the two. The IPCC has specific model-based definitions of ECS and TCR that do not translate to the real world. Here we focus on real-world estimates, not abstract model constructions. The IPCC tries to ignore these lower estimates and claims they are discredited (IPCC, 2013, p. 923), we think this is inappropriate.
The lower estimates come from Richard Lindzen (Lindzen & Choi, 2009), Sherwood Idso (Idso, 1998), Reginald Newell (Newell & Dopplick, 1979), and Willie Soon (Soon, Connolly, & Connolly, 2015). Lindzen’s estimate is about 0.5°C/2xCO2, Idso’s is 0.4°C/2xCO2, and one of Soon’s (he offers four) is 0.44°C/2xCO2. Newell and Dopplick derive 0.25°C/2xCO2 for the tropics. The researchers use a variety of datasets and methods, but all are observation-based. We will get into the details below and in a second post that will appear in a day or two.
There are other observation-based estimates, such as the well-known estimate by Nic Lewis and Judith Curry using historical CO2 and global temperature records. Lewis and Curry estimate TCR to be 1.2 (5%-95% range: 0.9-1.7) °C/2xCO2 (Lewis & Curry, 2018). Lewis and Curry’s work is excellent, but we will focus on the lower estimates in this post. We mention their work only to show that many, if not most, observation-based estimates of TCR are lower than the model-based estimates. Models that do not track observations should be ignored.
While AR5 does address Lindzen and Choi’s work, they ignore Idso’s estimate from 1998, Newell and Dopplick’s estimate from 1979, and Soon’s estimate was not yet published.
Lindzen and Choi
In a series of papers Lindzen and his colleagues have developed a robust hypothesis that rising sea surface temperatures (SST) cause some high-level tropical cirrus clouds to disappear, opening the sky so that more infrared radiation can escape into space, cooling the tropical atmosphere and surface. As mentioned above, the IPCC claims that net cloud feedback to warmer surface temperatures is positive and further warms the surface. CERES tells us that the overall impact of clouds is negative, but how cloud cover changes with surface temperatures is unclear. Lindzen’s investigation into this problem is illuminating.
Most tropical cirrus clouds, but not all, originate in the upper reaches of cumulonimbus towers. The hypothesis is that higher surface temperatures cause the precipitation efficiency within the cumulonimbus towers to increase, as well as the number of towers, therefore, there is less water vapor available high in the towers to form cirrus clouds (Lindzen & Choi, 2021). High-level cirrus block outgoing infrared radiation, but allow most incoming shortwave radiation in, so reducing cirrus covered area cools the surface.
Lindzen calls the reduction of cirrus cloud cover, due to rising surface temperatures, the “iris effect;” since it is analogous to opening an eye’s iris. This negative feedback is not part of most climate models, but Thorsten Mauritsen and Bjorn Stevens added it to their ECHAM6 climate model and found it caused the model’s results to move closer to observations (Mauritsen & Stevens, 2015). A one-degree increase in surface temperature reduces the cirrus cloud cover by 22% in the tropical Pacific, so it is significant.
The standard ECS, computed from the ECHAM6 model output, is 2.8°C/2xCO2. When the iris effect is added to the model, ECS always becomes smaller, and can fall to 1.2°C/2xCO2 in some scenarios. As mentioned above Lindzen computed an ECS of 0.5°C/2xCO2 from the cloud feedback parameter derived from ERBE (Earth Radiation Budget Experiment) satellite data. The precise impact of the iris effect has yet to be determined, but once incorporated, it always lowers both TCR and ECS.
Despite severe criticism over the past 20 years, including a paper entitled “No Evidence for Iris” in the Bulletin of the American Meteorological Society (Hartmann & Michelsen, 2002), the cooling iris effect is generally accepted today. What is still being debated is the magnitude of the effect. While in theory, the ECS can be computed from the total feedback, the calculation has many unknowns, these are described in Lindzen’s papers, especially the first one in 2001 (Lindzen, Chou, & Hou, 2001). Depending upon the assumptions made, Lindzen’s iris effect results in an ECS between the purely observation-based 0.5°C/2xCO2 (Lindzen & Choi, 2009) and the model-based 2.5°C/2xCO2 (Mauritsen & Stevens, 2015). While the range of possible values is large, they are all smaller than calculations that exclude the iris effect using the same assumptions.
Lindzen emphasizes that the cirrus cloud response to SST warming is essentially instantaneous, data lagged a month, or more are not usable and misleading. There are also factors other than SST that affect the area covered by cirrus clouds complicating the calculation. Statistically the longwave infrared (LW) feedback response to the iris effect is a reliable -4 W/m2K-1. That is, as SST goes up one degree, it results in 4 Wm-2 of LW RF cooling. But the loss of clouds also means more shortwave radiation (SW) hits the surface from the Sun, so the net amount of cooling is in doubt. The estimates in the increase of SW as a function of cirrus cloud cover are less precise than the cooling effect of escaping LW, but probably between 3 and 3.5 W/m2K-1. So, the exact amount of cooling due to the iris effect remains unknown, but there is general agreement that the iris effect exists, results in cooling, and reduces ECS and TCR.
Soon, et al., 2015
No one knows precisely how Earth’s surface temperature varies with insolation. Just like the weather, the energy flux at the top of the atmosphere changes, so long-term small changes, whether due to changes in the Sun, or the CO2 concentration, are obscured by short-term natural variability. Likewise, the surface temperature record has measurement problems, both systematic problems and instrument problems.
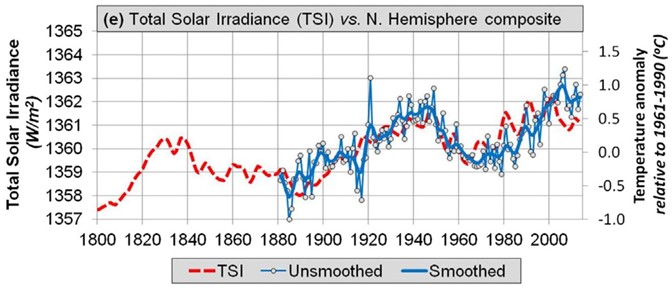
Willie Soon and colleagues were concerned that urbanization may have contaminated the global temperature network, so they created a record of Northern Hemisphere (NH) temperature using predominantly rural weather stations (Soon, Connolly, & Connolly, 2015). Their new record was compatible with NH SST trends and records of glacier advances and retreats. The record was combined with a NH SST record and compared to the Hoyt and Schatten TSI (Total Solar Irradiance) reconstruction as modified by Scafetta and Willson (Scafetta & Willson, 2014). The match was quite good as you can see in Figure 2.

Figure 2. Soon, et al.’s Northern Hemisphere rural-only temperature record (in blue) versus TSI (in red). Source: (Soon, Connolly, & Connolly, 2015).
The least squares fit of the curves in Figure 2 results in a set of residuals that is quite small. The R2 is 0.48 to 0.5 and the slopes are 0.1 to 0.211°C/Wm-2. Soon and colleagues assumed that the temperature variation that was unexplained by the change in TSI was due to increasing the CO2 concentration and, depending upon how they did the calculation, resulted in a climate sensitivity between 0.44°C/2xCO2 and 1.76°C/2xCO2 (Soon, Connolly, & Connolly, 2015).
The TSI reconstruction shown in Figure 2 is similar to many others, as shown in Soon, et al., but the IPCC generally ignores the more active TSI reconstructions and favors more invariant reconstructions that make it appear that CO2 is the dominant factor in recent warming. The key point is that the climate models are tuned to the various global temperature records, which may very well be contaminated by the rapid urbanization that took place in the 20th century. The tuned IPCC models of natural warming assume a nearly invariant Sun, so when the natural-only modeled temperature is subtracted from the anthropogenic plus natural model to extract the human (or CO2) component of warming, all the warming is assigned to humans and CO2. This IPCC process is described here. The post also displays plots of various peer reviewed TSI reconstructions, those used by the IPCC and those they ignore.
Conclusions
In this post we compare the IPCC view of climate sensitivity to two modern observation-based estimates that are lower. In particular the low-end of the ranges that Lindzen, Soon and their colleagues calculate are much lower than the low-end estimate by the IPCC, yet they are based on reasonable assumptions and observations.
In the next post we will look at older, but still valid, observation-based estimates of climate sensitivity. The next post will also investigate estimates of surface air temperature sensitivity to radiative forcing. One main point, is that the impact of doubling CO2 is tiny compared to natural changes. As you can see in Figure 2, very small changes in solar output, 4W/m2 or 0.3% of 1361 W/m2 can make nearly as much difference as all the CO2 emitted to the atmosphere by humans. Likewise yearly observed changes in cloud RF are larger than the impact of human-emitted CO2. The impact of CO2 on climate is too small to measure, thus we are arguing and panicking over something that likely doesn’t matter.
Download the bibliography here.

Andy May, now retired, was a petrophysicist for 42 years. He has worked on oil, gas and CO2 fields in the USA, Argentina, Brazil, Indonesia, Thailand, China, UK North Sea, Canada, Mexico, Venezuela and Russia. He specializes in fractured reservoirs, wireline and core image interpretation and capillary pressure analysis, besides conventional log analysis. He is proficient in Terrastation, Geolog and Powerlog software. His full resume can be found on linkedin or here: AndyMay
