In Part 1, we introduced the concepts of climate sensitivity to CO2, often called ECS or TCR. The IPCC prefers a TCR of about 1.8°C/2xCO2 (IPCC, 2013, p. 818). TCR is the short-term, century scale, response of surface temperature to a doubling of CO2, we abbreviate the units as “°C/2xCO2.” In these posts we review lower estimates of climate sensitivity, estimates below 1°C/2xCO2. In parallel, we also review estimates of the surface air temperature sensitivity (SATS) to radiative forcing (RF, the units are °C per W/m2 or Watts per square meter). The IPCC estimates this value to be ~0.49°C per W/m2.
The previous post discussed two modern climate sensitivity estimates, by Richard Lindzen and Willie Soon, that range below 1°C/2xCO2. Next, we review climate sensitivity estimates by Sherwood Idso, Reginald Newell and their colleagues.
Many comments to part 1 tried to discredit the “ECS” or “TCR” estimates made by Lindzen and Soon, completely missing their point and my point. ECS and TCR are artificial climate model constructs, with little meaning outside the confines of computer modeling. TCR is a little more realistic since we might be able to observe or measure something close to it over the next century. But ECS, or the “Equilibrium Climate Sensitivity” is a totally abstract and unworldly number that could never be measured. It means if CO2 doubled suddenly, and nothing else changed for several hundred years while the oceans came into equilibrium with the new surface air temperature, what would the final surface temperature be? Air temperature would never be close to equilibrium for several hundred years, even 70 to 100 years (TCR) is a stretch.
Climate models are not the real world and the numbers that come out of them, like ECS or TCR, can be useful for showing the likely direction of temperature movement in response to changes in parameters or different model scenarios, but the numbers themselves are meaningless unless the models have previously been validated against the real world. With the possible exception of the Russian INM-CM4 model, no other IPCC model has successfully predicted future global surface temperatures. Ron Clutz discusses INM-CM4 here.
Model calculations are not observations. ECS and TCR are not real numbers, real numbers are based on observations. Thus, the model extracted values of ECS and TCR are not information, they can be used to detect the direction of change in climate forcing, if the climate model is an accurate reflection of that portion of the real world. The direction of movement of ECS and TCR, when model parameters or data tables change, is the information, not the computed value. I’m often amazed, as a former petrophysical modeler of 42 years, how often otherwise intelligent people confuse unvalidated model calculations with observations.
Scientists don’t prove things, scientists disprove ideas, that is how it works. Analogous to what Lindzen and Soon did (see part 1), we are not recommending any particular estimate of climate sensitivity, our point is that there are observations and well developed scientific, testable hypotheses (like the active TSI reconstructions or the iris effect described in part 1) that suggest TCR (and maybe ECS, as defined by the modelers) are less than 1°C/2xCO2. Arguing that the specific values computed by Soon and Lindzen are incorrect is silly, that is not their point or my point. No one knows what the climate sensitivity to CO2 is, all estimates, including Lindzen’s and Soon’s, are little more than educated guesses. They simply show that the high estimates favored by the modelers and the IPCC are too high, given the data they have seen and analyzed.
The climate effect of human-emitted CO2 is too small to measure. Nature provides some hints about the general range of CO2 climate sensitivity; these posts discuss those that suggest the sensitivity might be below 1°C/2xCO2. The “consensus” climate scientists have been trying to observe or measure the impact of human CO2 emissions for decades and have failed. Model and laboratory measurements do not count, because natural feedbacks to changing CO2 concentration and to direct CO2-induced warming are so poorly understood, the total effect could be net warming or net cooling. Two of the larger unknowns, natural solar variability and the effect of surface temperature on cloud cover were covered in part 1.
Now we will look at older estimates of climate sensitivity. It is illuminating to compare this early work to modern the estimates by the IPCC, Lindzen and Soon.
Idso, 1998
Sherwood B. Idso was a researcher for the U.S. Department of Agriculture at the U.S. Water Conservation Laboratory in Phoenix, Arizona and an Adjunct Professor at Arizona State University. His primary area of research was the impact of carbon dioxide on plants and global temperatures. Idso cleverly evaluated eight natural phenomena or “natural experiments,” as he called them. These natural experiments provide clues to the cumulative effect of greenhouse gases on global warming. Afterward, he concluded that raising the atmospheric CO2 concentration from 300 ppm to 600 ppm should result in an increase in global surface temperature of about 0.4°C.
Idso measured downwelling atmospheric IR (infrared radiation) in Phoenix, Arizona and plotted it versus water vapor pressure (Idso, 1981). They did not correlate during the day but did just prior to sunrise. This allowed him to calculate a SATS of 0.173°C per W/m2. Thus, at Phoenix, when downwelling IR rose one W/m2, surface temperature would rise 0.173°C. At the time Idso had no reason to believe this applied anywhere except Phoenix.
The air over Phoenix has a high level of dust. The dust is 2,500 meters higher in the summer than in the winter, when it is near the surface and below a city park 500 meters higher than the city. Dust radiates in the infrared (10.5 to 12.5 μm). This results in 13.9 W/m2 more net radiation at the park in the winter. Idso’s measurements showed that the transmission of solar radiation was unaffected by the altitude of the dust, but the dust distribution did affect the radiation striking the ground. As a result, the temperature in winter is 2.4°C warmer in the city than it should be. Dividing 2.4° by 13.9 W/m2 is 0.173°C per W/m2 (Idso, 1981b). Idso did not expect these latter two SATS values to agree so well. As intriguing as this natural experiment is, Idso did not pursue it. He felt the scatter of the data was too large and the methodology too uncertain. In the end he did not use this result.
Next Idso broadened the area of his study and looked at the range of solar radiation reception at 81 sites around the U.S. (Bennett, 1975). When these values were corrected for global albedo and plotted versus the annual temperature ranges the points fell into two groups, one for the interior of the U.S. and one for the west coast. The plot for the interior was 0.171°C per W/m2, essentially identical to the value for Phoenix, the west coast value was about half that at 0.084°C per W/m2, reflecting the influence of the Pacific Ocean (Idso, 1982). Using the global ratio of land area to ocean area of 30%, Idso calculated an upper bound of 0.113°C per W/m2 for the entire planet and called it the upper bound of the global SATS factor.
This caused him to consider the effect of rising CO2 on climate. Idso estimated that the effect of doubling CO2 on downwelling radiation is about 2.28 W/m2. This is in the same ballpark as the IPCC, in AR5, they compute the total CO2 forcing from 1750 to 2011 (278 ppm to 391 ppm, ~41% increase) as 1.82 W/m2 (IPCC, 2013, p. 676). The IPCC gives a value for doubling CO2 of 3.7 W/m2, but they assume large positive feedbacks that may or may not be correct (IPCC, 2007b, p. 140). Figure 1 illustrates the IPCC estimates of human and natural radiative forcing.
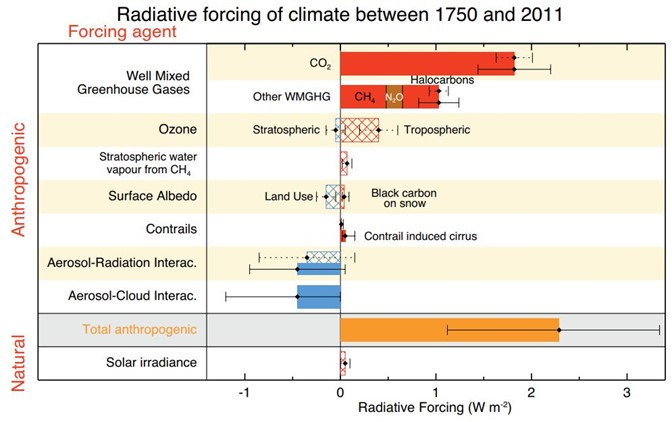
Figure 1. IPCC AR5 estimates of anthropogenic and natural radiative forcing. Source (IPCC, 2013, p. 697).
Idso’s observation-based estimate for the SATS factor is then 0.113°C per W/m2. Multiplying these values gives us a range of global warming, due to doubling CO2, from 0.113 x 2.28 = 0.26°C (Idso) to 0.113 x 3.7 = 0.42°C (IPCC). Not much.
Next Idso combined the annually-averaged equator-to-pole gradients of total surface absorbed radiant energy (Idso, 1984), mean surface air temperatures (Warren & Schneider, 1979) and water vapor pressures (Haurwitz & Austin, 1944). This was done in 5° latitude slices from the South Pole to the North Pole. Idso found two distinct relationships from these slices, one from 90°NS to 63°NS and one from 63°NS to the equator. He then area-averaged these values and derived a mean global value of 0.103°C per W/m2, not too different from the preceding values. Of the values derived here, this is the one Idso had the most confidence in.
He multiplied 0.1 times 4 W/m2, and derived a climate sensitivity of 0.4 °C/2xCO2. Four was the value most often cited in 1998 as the radiative perturbation caused by doubling CO2, it was refined to 3.7 W/m2 in AR4. This increase, year-on-year of ~0.037 W/m2/year is within the calibration error of our measurements (Loeb, et al., 2018). AR5 suggests a value of about 0.3 W/m2 per decade for the period from 1951 to 2011 (IPCC, 2013, p. 699). Figure 2 compares the Warren & Schneider average surface air temperatures by latitude slice to modern ocean mixed layer temperatures. The ocean mixed layer begins just below the very thin “skin” temperature of the ocean. The mixed layer is a zone of almost constant temperature that extends from about a millimeter of depth to ~50 meters or so of depth, depending upon location and meteorological conditions. It is in close contact with the surface.
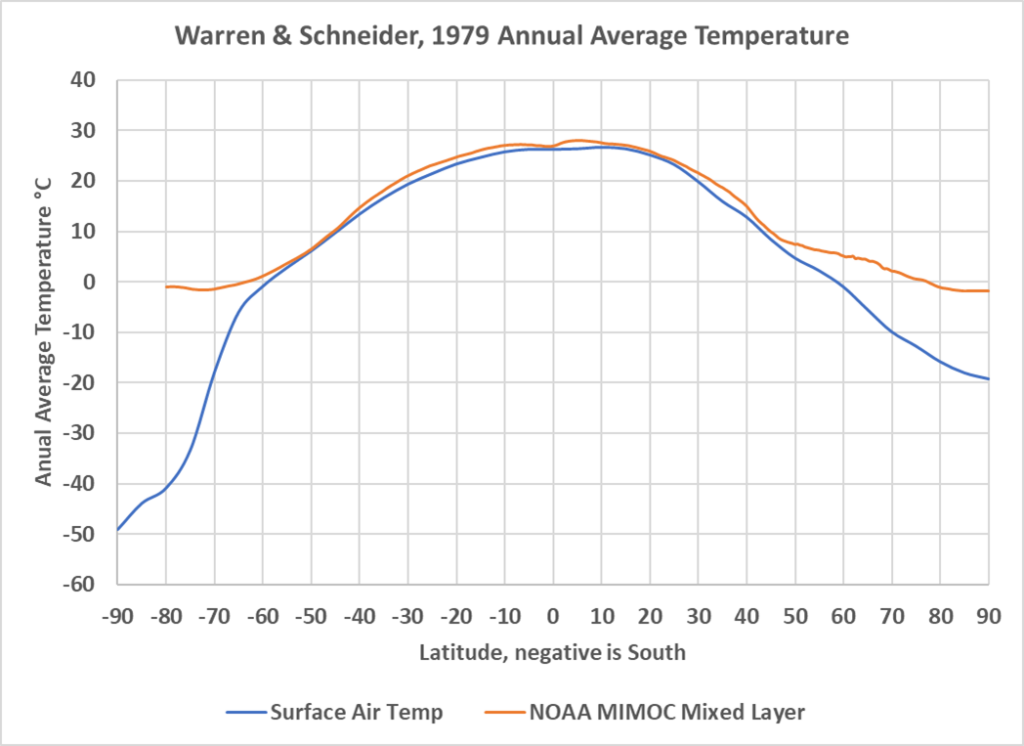
Figure 2. The blue line is the Warren and Schneider surface air temperature by latitude. The orange line is the NOAA MIMOC Ocean mixed layer temperature average by latitude.
In Figure 2 the air temperature follows the mixed layer temperature quite well from about 55°S to 45°N, but south and north of these points the ocean temperatures are much warmer than the air temperatures. This might account for some of the difference in trends observed by Idso. Idso’s plot, illustrating the two trends is shown in Figure 3.
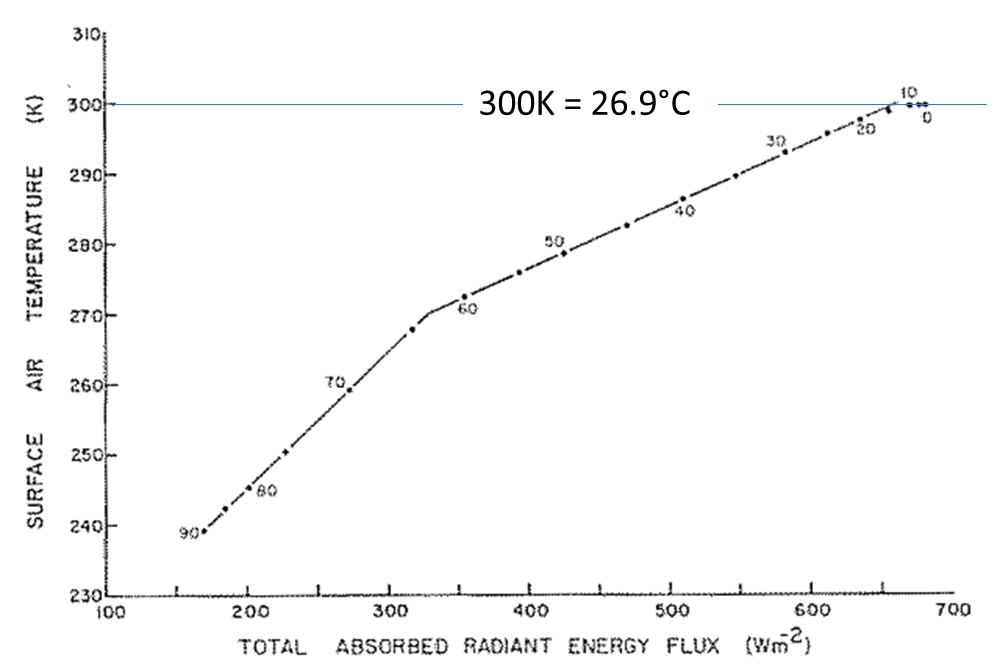
Figure 3. The two trends of surface absorbed radiation versus temperature observed by Idso. The numbers on the plotted lines refer to latitude north or south. Idso’s data flattens at 27°C. After: (Idso, 1984)
Next, Idso considers the faint Sun paradox. The early Sun only put out 70% to 80% of the power it sends out today, but life evolved, and the world did not freeze. Idso plotted up the appropriate CO2 concentration, solar irradiance, and temperature values he could find at 500 million-year intervals and found that he still derived 0.4°C/2xCO2.
Finally, Idso looks at the change in SST as a result of a change in downwelling radiation. Direct measurements by Francisco Valero and colleagues showed that a 14 W/m2 increase in downwelling IR caused a one-degree Celsius increase in SST. Division results in 0.071°C per W/m2, close to 0.1. The air temperature above the sea surface should be similar.
Newell and Dopplick, 1979 v. Manabe and Wetherald, 1975
As Idso explains in his 1984 paper, the current IPCC AR5 estimate for ECS of 1.5 To 4.5°C was also the prevailing estimate then. The National Research Council published the same estimate in 1979 (Charney, et al., 1979). The range of “consensus” values has not changed in 42 years and may broaden with AR6. Idso was not the only scientist at the time to protest the high estimates. Newell and Dopplick also criticized them in 1979 (Newell & Dopplick, 1979).
Reginald E. Newell was an MIT Professor of Atmospheric Physics. He and Thomas Dopplick computed a net change in CO2 RF at the surface of 0.8 to 1.5 W/m2 for a CO2 increase from 330 ppm to 600 ppm, in the tropics, assuming a constant temperature. Assuming a constant temperature in the tropics is reasonable, most of the tropics are ocean, and nearly all cooling there is via convection. This is why tropical temperatures don’t change much over time. Their value is less than the values used by the IPCC and Idso, but does not consider the possibility that a slightly higher temperature may increase total atmospheric water vapor, a very strong greenhouse gas, and thus further increase the downwelling RF.
Newell and Dopplick derived a SATS factor, for CO2 alone, of 0.03°C per W/m2 over the oceans in the tropics. His calculation of the total SATS, including water vapor and all other factors for the whole globe, is the same as Idso’s, 0.1°C per W/m2. This latter calculation was made using radiation data taken after the eruption of Agung in 1963.
Manabe and Wetherald (M&W), in 1975, derived an extraordinarily high SATS estimate of 1°C per W/m2, which is twice that used by the IPCC today (Manabe & Wetherald, 1975). This is because M&W start with a very high tropical SST of 306-307K (33°C) and finish with 310 (37°C) after the warming; and these temperatures are probably not possible. Due to the vapor pressure of water in the open tropical ocean, evaporation will limit SST to approximately 30°C, as Newell and Dopplick showed in 1978 and Willis Eschenbach and Richard Willoughby (Part 1 to Part 4) have shown at Wattsupwiththat.com. Figure 4 is Newell and Dopplick’s illustration, slightly modified.
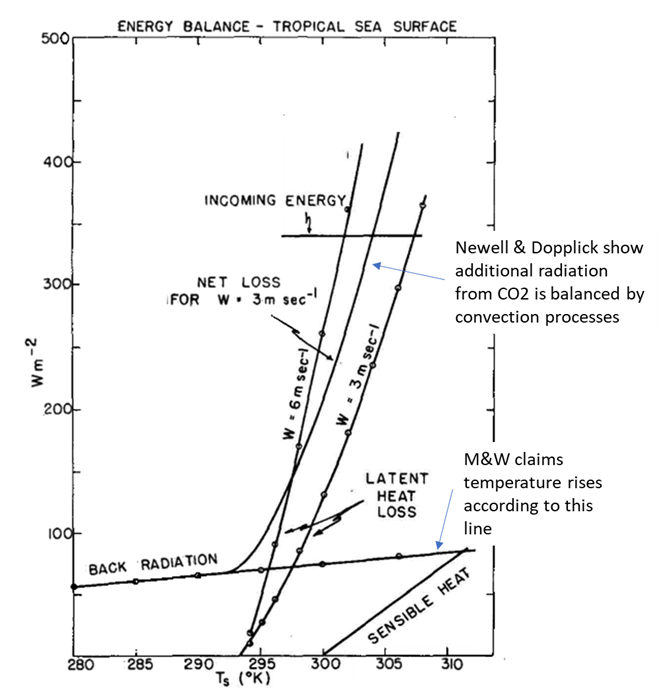
Figure 4. Newell and Dopplick’s 1979 figure explaining how excess back radiation from CO2 can be balanced. The straight “back radiation” line is followed if the back radiation is simply emitted by the surface, the curved lines show the excess radiation carried away as latent heat of evaporation. After (Newell & Dopplick, 1979, Fig. 1).
Manabe and Wetherald claimed to include convection processes in their model, but their high sensitivity values and surface temperatures don’t make a lot of sense. Möller published a more sensible sensitivity of 0.5°C per W/m2, based on radiation balance, in 1963 (Möller, 1963). Newell and Dopplick show that, over the oceans, “the dominant factor in controlling tropical air temperature is latent heat liberation.” They realized that over arid inland regions, this is not true, so they used Möller’s radiation-balance sensitivity for those areas. Combining the two based on their respective area in the tropics, they calculated a SATS of less than 0.25°C/2xCO2.
The reasons why the open ocean surface, and the air above it, are limited to 30°C are explained very well in Willoughby’s four-part series on the topic. Basically, water vapor above the oceans works to warm the air up to 27-28°C and above that it cools the air. This can be seen in one of Willoughby’s plots, see Figure 5.
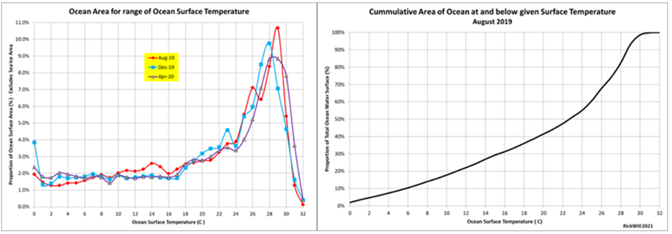
Figure 5. On the left is the percent of the ocean at specific temperatures, it peaks at different temperatures depending upon the month, but always between 28 and 30 degrees. The right plot shows the cumulative area of the ocean at specific temperatures, it reaches 100% at 30°C. Source: Richard Willoughby.
The same flat spot seen in Idso’s 1984 plot in Figure 3, is seen in the right-hand plot of Figure 5. If oceans exist, Earth’s maximum surface temperature is capped at 30°C or 86°F. Oceans cover 70% of the surface, and even when a portion of the world ocean reaches temperatures higher than 30°C for a brief time (usually in small areas of the Indian Ocean, the Persian Gulf, or Caribbean), a storm will develop to cool them, if the humidity is high enough. Chris Scotese has shown that over the past 500 million years the global average temperature has never exceeded 28°C, supporting this concept.
The high SSTs predicted by Manabe and Wetherald in 1975 have never been observed and are very unlikely to be observed in the future. This invalidates their estimate of climate sensitivity. The high SATS to radiative forcing used by the IPCC (0.49°C per W/m2) is also suspect, as it is more appropriate for deserts than the open ocean.
Conclusions
Looking at these early debates over the SATS factor and climate sensitivity is illuminating. Somebody will object to the age of the articles cited in this post, but if you “… do not learn history [you] are doomed to repeat it.” (Churchill, 1948, speech to Parliament). And we are repeating it, we are asking the same questions asked 40 years ago, debating the same points, and the instruments we have today still cannot detect the values we need to tell us who is correct.
The effect of CO2, man-made or otherwise, has never been observed or measured by anyone, but not for lack of trying. Some estimates are based on observations, like those cited in these posts, and some are based on climate models. The IPCC tries to digest all these indirect estimates and come up with a range of possible values, the IPCC AR5 collection of values are illustrated in Figure 6.
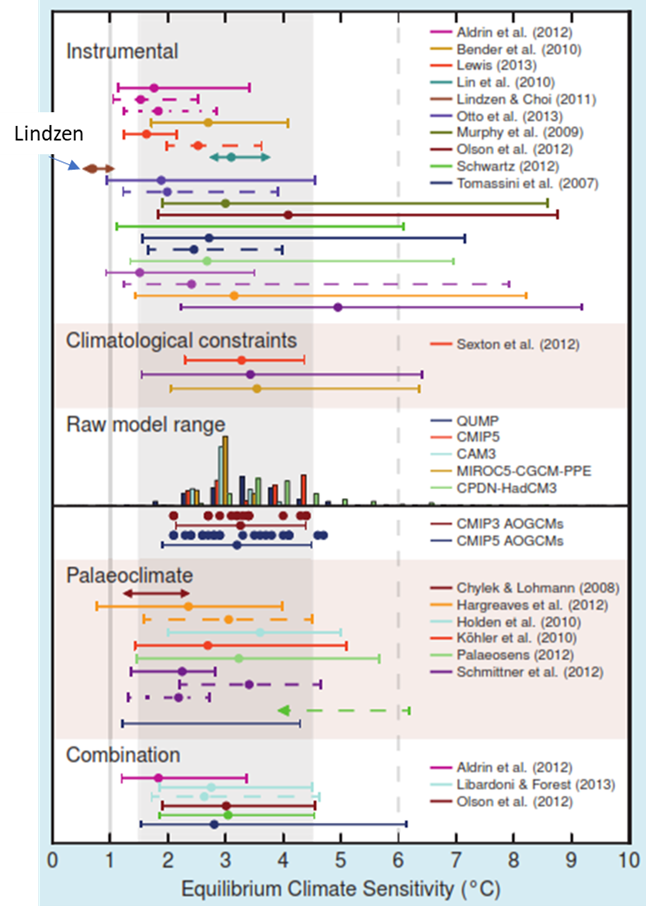
Figure 6. The IPCC AR5 collection of ECS estimates. Source (IPCC, 2013, p. 1110).
The IPCC does not independently estimate climate sensitivity (whether ECS or TCR), they simply collect estimates from others and make an educated guess of the likely value and range. A quick glance at Figure 6 shows that Lindzen’s estimate, from post 1, is in their list, but it is an outlier. They have completely ignored Idso’s and Newell’s estimates. Then, they pick a possible range of ECS estimates, which is an educated guess based on educated guesses. They have no independent observations to guide them, and they exclude several peer-reviewed, still-valid estimates that lie below their minimum. They give no reason why; they simply ignore Newell and Idso’s work. Soon’s work had not been published yet, so they have an excuse.
Multiple sets of observations and multiple researchers, cited in these posts, lead us to believe the climate sensitivity to CO2 might be less than 1°C/2xCO2. Further, the SATS factor may well be less than, or equal to, 0.1°C per W/m2. Contrast this with the IPCC SATS value of 0.49°C per W/m2, which is likely only appropriate in arid regions and on land. Why use it over oceans where convection does almost all the cooling?
The “consensus” estimates of the impact of greenhouse gases, especially CO2, on climate and global warming are the same as they were 42 years ago. The uncertainty has not narrowed. Observations invalidate the high IPCC modeled climate sensitivity today, just as they did for the National Research Council in 1979.
Consider that even the most alarming estimate of the warming impact of CO2 is tiny. It is so small it cannot be measured, which is the main reason estimates have not improved. How can you measure something you can’t see?
I think probably everyone recognizes that the climate sensitivity to human emissions of CO2 and other man-made greenhouse gases are key to settling the great climate debate. If climate sensitivity, whether we call it ECS, TCR, or “CS,” is high or low matters a great deal. For example, if climate sensitivity is less than 1.2, which is very possible, it would take over 200 years for us to reach the “magic” two-degrees of global warming that some think is dangerous. I use “magic” deliberately because there is little evidence that 2°C of warming is truly dangerous. After all the world is now five degrees cooler than the average for the Phanerozoic and people currently live both in Greenland, where winter temperatures are -50°C, and in the Sahara where summer temperatures reach 50°C.
It is terribly sad that, after spending billions of dollars and untold man-hours, we have not narrowed the range of climate sensitivity to CO2 since 1979. It is time to grow up and realize that measuring these tiny numbers cannot be done today. We also should recognize that the climate sensitivity numbers we need to measure are so small, it is unlikely they matter. As Möller wrote in 1963:
“The effect of an increase in CO2 from 300 to 330 ppm can be compensated for completely by a change in the water vapor content of 3 per cent or by a change in the cloudiness of 1 per cent of its value without the occurrence of temperature changes at all. Thus the theory that climatic variations are effected by variations in the CO2 content becomes very questionable.” (Möller, 1963).
This is still true today. An exceedingly small change in cloudiness, or a small change in the distribution of cloud types, or a tiny, imperceptible change in total atmospheric water vapor could completely wipe out any change due to additional CO2. As Lindzen and Newell showed decades ago, these changes (or feedbacks) may be automatic. It is especially important for the climate establishment, the media and the “climatariate” politicians and bureaucrats to recognize how little we know. Model results are not observations, they may help directionally, but they are useless for determining climate sensitivity unless they can predict future climate accurately, something that has not happened to date. As far as climate change goes, humans likely don’t matter as far as anyone can see today. We didn’t matter in 1979, we don’t today, and if we did make a difference, we couldn’t measure it anyway.
Download the bibliography here.

Andy May, now retired, was a petrophysicist for 42 years. He has worked on oil, gas and CO2 fields in the USA, Argentina, Brazil, Indonesia, Thailand, China, UK North Sea, Canada, Mexico, Venezuela and Russia. He specializes in fractured reservoirs, wireline and core image interpretation and capillary pressure analysis, besides conventional log analysis. He is proficient in Terrastation, Geolog and Powerlog software. His full resume can be found on linkedin or here: AndyMay
