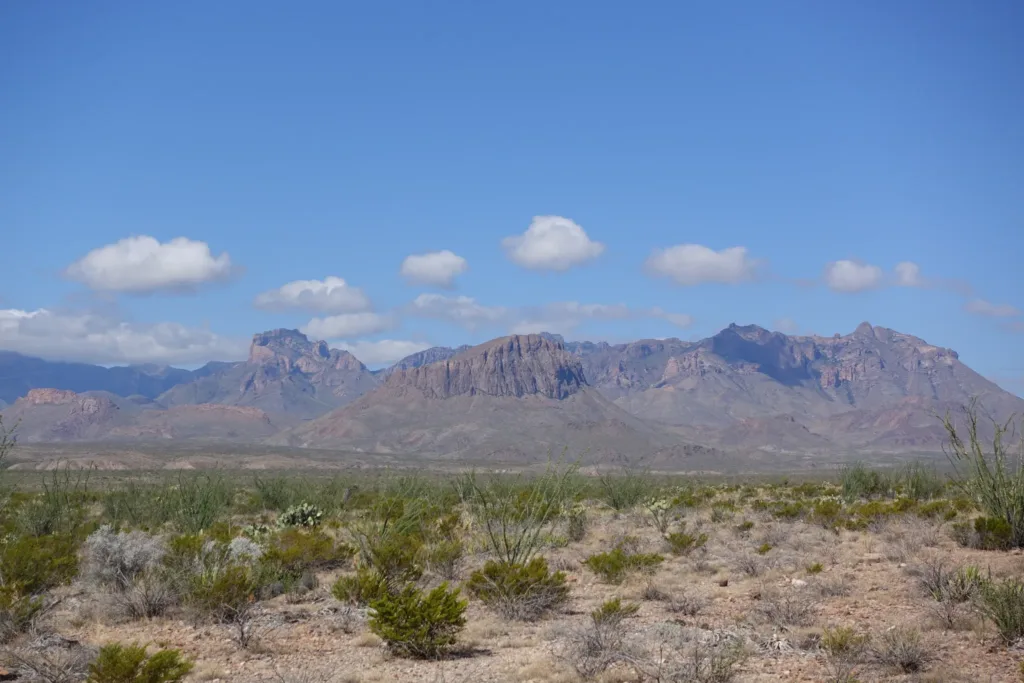
The featured image is a photograph of the Big Bend area in Texas in October 2015 when the drought index was moderately moist. The photo was taken by the author.
Stories of some sort of current catastrophic drought in the western U.S. are greatly exaggerated (apologies to Mark Twain). While the western U.S. is dry due to its location under a zone of perpetual high atmospheric pressure and little rain, the present drought conditions in the region are moderate by historical standards. This post is mostly an update of two earlier posts by Anthony Watts here and here. Watts’ posts have stood the test of time quite well. It is amazing how often the “consensus” recycles old, debunked myths.
We should distinguish between meteorological droughts which are a long-term reduction in precipitation (IPCC AR6 WGI, pages 1157 & 1760) caused by persistent high atmospheric pressure that reduces cloud formation and agricultural drought which is a reduction in soil moisture and reduced flow in waterways (also called hydrological drought). Meteorological drought is a climatic phenomenon, and agricultural drought is only partly meteorological since it can be alleviated by irrigation, dams, and other man-made changes to drainage systems designed to reduce the flow of valuable fresh water into the oceans. This post is about meteorological drought and long-term drought cycles.
Deserts occur in two bands around the Earth. In the Northern Hemisphere they occur between roughly 20° and 40° North. The band of Northern Hemisphere deserts includes a small portion of the North American Southwest as shown in figure 1, modified from (Cherlet, et al., 2018). The curvature of the band is due to the northern position and curvature of the ITCZ or the Intertropical Convergence Zone.
The ITCZ is the climatological equator, which constantly moves from its southern position during the Northern Hemisphere winter to its summer position in the far north, and then back again. Since the Sun is always directly overhead at noon locally in the ITCZ, evaporation is always maximal. The evaporated water vapor, which is less dense than dry air, rises creating an updraft. When the water vapor rises high enough, it condenses into rain and clouds and the remaining dry air, which is denser than humid air, falls. This creates high-pressure zones that result in deserts.
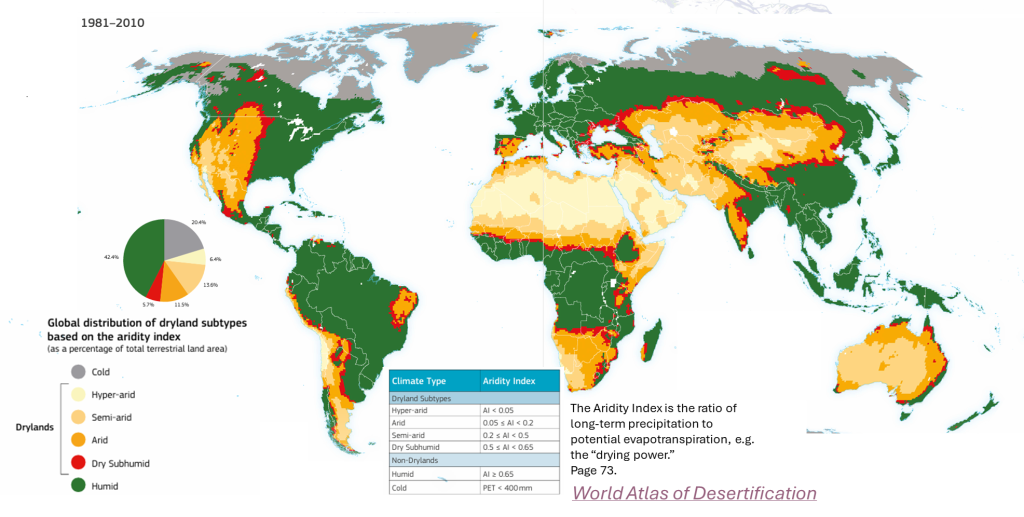
Figure 1. Map of world deserts using the Aridity Index, a measure of the drying power of the climate. True deserts are shown in the lighter yellow. Source: The World Atlas of Desertification.
The timing of drought conditions in the southwestern U.S. is mostly controlled by ENSO (El Niño & La Niña), and influenced by the ~22-year Hale Solar Cycle, the ~100-year Feynman Solar Cycle, the ~67-year AMO (the Atlantic Multidecadal Oscillation), and the Pacific Decadal Oscillation (Mitchell, Stockton, & Meko). Also see Jiang, et al. 2019 (Jiang, Yu, & Acharya, 2019) here. Figure 2 shows the area evaluated, and figure 3 is an assessment of climate proxies in the western continental United States.
The percent of the western United States in drought is shown in figure 3. The measure of drought used is the Palmer Drought Severity Index of PDSI (Palmer, 1965). PDSI values less than -1 are considered to be drought conditions in the figure. Wayne Palmer devised the index that bears his name. It is a measure of how unusually dry or wet an area is according to its long-term average climate. For a description of the PDSI calculation and a review see here (Heddinghaus & Sabol, 1991).
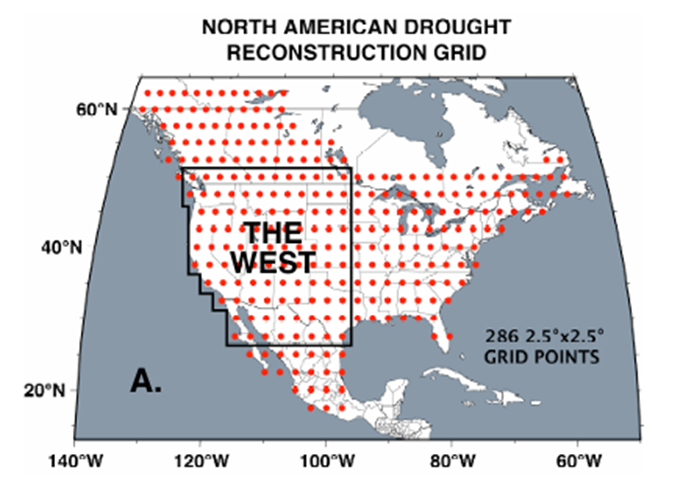
Figure 2. The region studied. Drought in the western U.S. is plotted in figure 2. Source: (Cook, Seager, Cane, & Stahle, 2007).
The PDSI is objective and avoids arguments over drought that are based on the effects, such as reduced flow in streams (hydrological drought), reduced soil moisture that affects crops (agricultural drought) or the effect on the economy. The economic effects of drought can be caused by meteorological drought or can be due to development (or overdevelopment) that is based on a need for more water than is available in the area.
The Palmer Index is based on precipitation and temperature records and a simple supply-and-demand model of soil moisture. It is not very effective over short periods of time, but can describe long-term (many months or years) conditions quite well. The index varies from -10 to 10, with negative numbers indicating declining soil moisture (drought) and positive numbers indicating wet conditions. Zero is neutral or “normal” as determined from historical records. One of the advantages of PDSI is it is widely used and values (either from instrumental readings or climate proxies) exist over long periods and in many areas. Figure 3 plots the area in drought, in the western U.S. since 800AD. Drought severity is not just a function of the PDSI, but also the size of the area affected and the duration of the precipitation deficit. The data used to create the index in figure 3, before the instrumental era, is mostly from tree ring proxies (Cook, Seager, Cane, & Stahle, 2007).
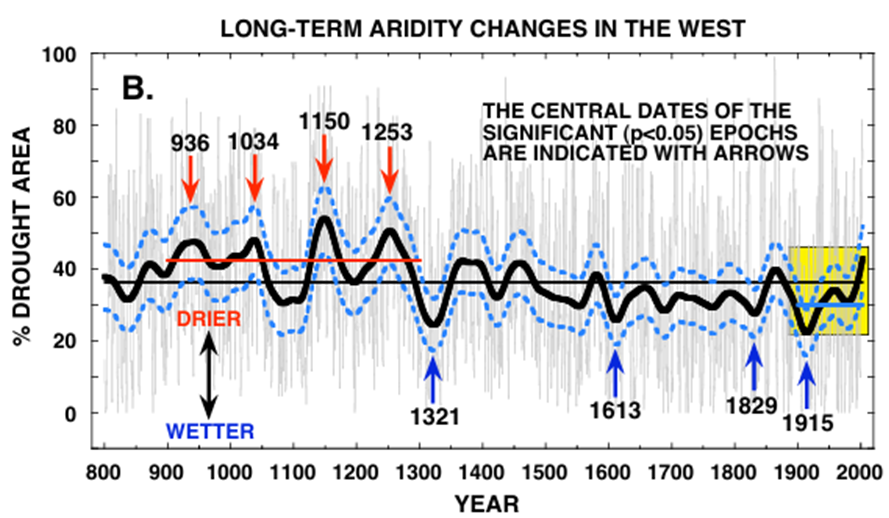
Figure 3. Proxy drought record since 800AD. The percent of the area in drought (PDSI< -1) is plotted. The twentieth century, to 2003, is marked with yellow shading. The average drought area for 900 to 1300 is shown as a red line and the average drought area for the 20th century is shown with a blue line. A much larger area was in drought from 900 to 1300. Source (Cook, Seager, Cane, & Stahle, 2007).
Currently drought conditions in the western U.S. are modest, relative to the beginning of the Little Ice Age around 1300AD. It can get much worse than the conditions that exist today. Matthew Bekker and colleagues (Bekker, DeRose, Buckley, Kjelgren, & Gill, 2014) point out in their study of tree rings around the Weber River in Utah:
“While the 20th Century instrumental period includes several extreme individual dry years, it was the century with the fewest such years of the entire [576-year] reconstruction. Extended droughts were more severe in duration, magnitude, and intensity prior to the instrumental record, including the most protracted drought of the record, which spanned 16 years from 1703 to 1718.”
The majority of dry years around the Weber River occurred in the 1400s and the 1500s, well before human emissions of CO2 and other human activities were significant. There were several periods of drought in the 20th century, and the worst period of drought was around 1934 as shown in figure 4.
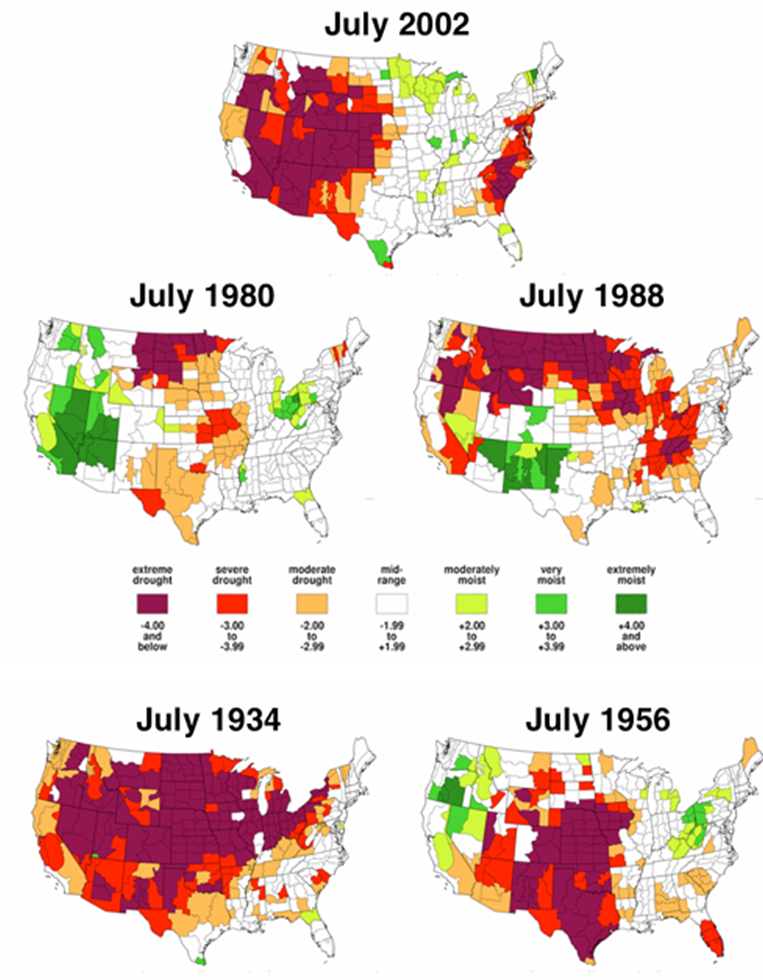
Figure 4. Periods of drought in the US in the 20th century. Colors indicate the Palmer Drought Severity Index (PDSI), purple and red denote extreme or severe drought and the greens indicate moderate to extremely moist. Source: (Cook, Seager, Cane, & Stahle, 2007).
Using the same criteria and color scheme, figure 5 shows the Palmer Drought Severity Index for the United States in July 2019.
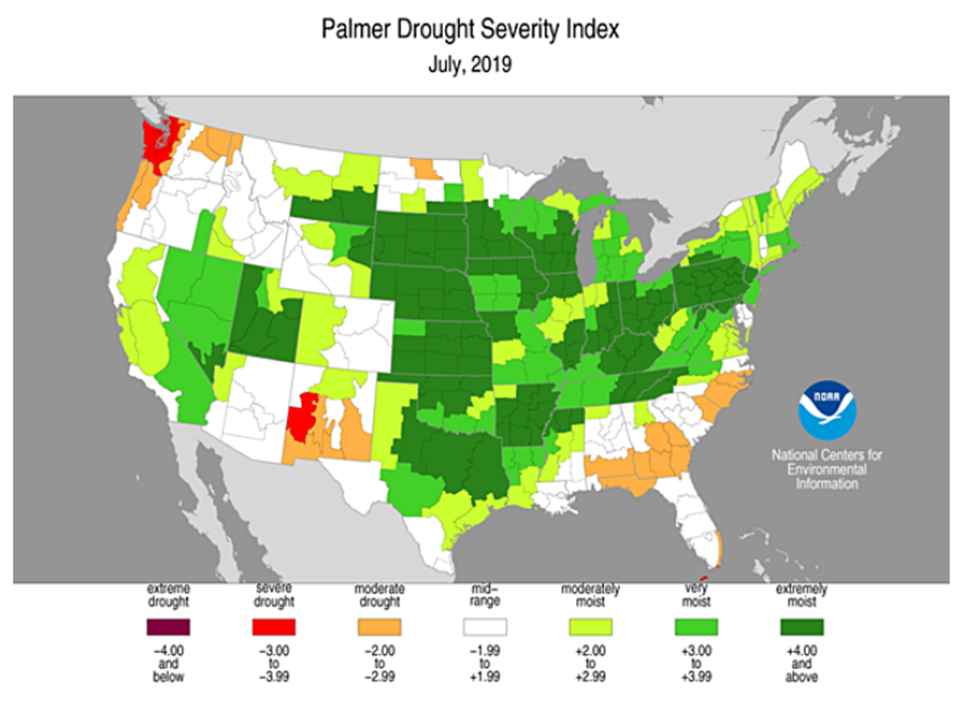
Figure 5. The Palmer Drought Severity Index for July 2019 using the same criteria as in figure 4.
In contrast to the drought years mapped in figure 4, 2019 is relatively normal to moist over most of the country as shown in figure 5. The southern New Mexico area in red and the far northwest are the only areas in severe drought.
Figure 6 shows the conditions in December 2024. The Big Bend area in south Texas is the only large area in exceptional drought (deep red) or severe drought (red), the other areas are small. Today the country is much better off than in 1934.
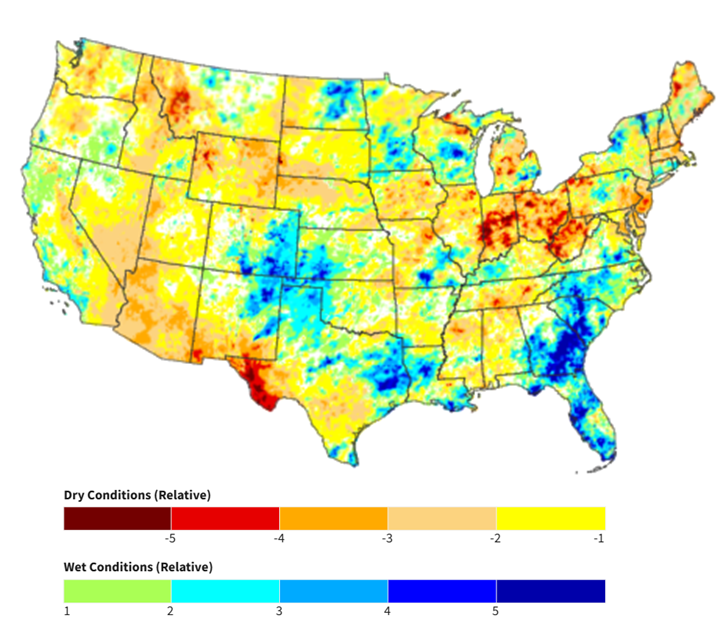
Figure 6. Regions of drought December 2024. Exceptional drought is shown in dark red and extreme drought in red. Note this measure is comparable to the Palmer Drought Severity Index (PSDI) used in figure 4, but higher resolution and a shorter time-period. Red and dark red on this map are equivalent to purple in figure 4. Source: NOAA and NIDIS.
Drought in the southwest has always come and gone in a semi-periodic fashion, usually in cycles of about 22 years and a longer cycle of about 100 years. When the Pike expedition of 1806-1807 went through the southwest it was extremely dry and helped create the “Great American Desert” myth. Later, in the 1870s, when the early transcontinental railroads were built, it was wetter, and people called it the “Garden of the Great Plains.” (Cook, Seager, Cane, & Stahle, 2007). Historical perspective is important.
Droughts can start and end quickly, especially in drought-prone areas like the American Southwest. It is hard to characterize drought in an area with static maps. For an animation of the PDSI over the U.S. over a selected period of time, see here. Especially when interpreting news reports of droughts, this site can help keep some perspective.
Parts of the Southwest always seem to be in drought, but the dry areas move around a lot. 2009 to 2010 were good years followed by drought in 2011-2014. 2015 through 2017 were pretty good, 2018 was dry and 2019 through the middle of 2020 was good. Then in mid-2020 it turned dry and now is showing signs of getting better, except in the Big Bend area of Texas and southern New Mexico. The takeaway is that, while the American Southwest is a drought prone area, the drought comes and goes, and is much less severe than in the past, especially from 900 to 1300AD.
Download the bibliography here.
