By Dr. Lars Schernikau, energy economist, entrepreneur, commodity trader – Reposted from Watts Up With That

Introduction
Water is the third most important molecule in our atmosphere making up about 1% of its composition (Figure 1). Nitrogen (77%) and Oxygen (21%) are the most important components. Water vapor is also the most important green-house gas in our atmosphere.
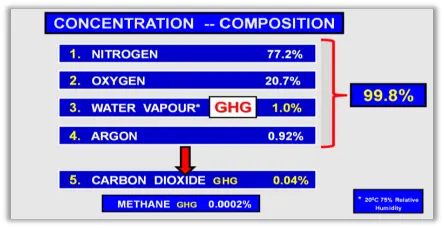
Figure 1: Composition of Atmosphere
Greenhouse gases (GHGs) keep our atmosphere about 33C warmer than it would be without. The average global temperature is roughly 15C. At an average -18C (15 – 33 = -18) humanity and most animals would have difficulties surviving. It is estimated that water vapor makes up over 90% of that total 33C GHG-effect (MIT once reported 97%, others say less). Other greenhouse gases include carbon dioxide CO2, methane CH4, nitrous oxide N2O, ozone O3, and more.
- CO2 (in total, not just from human causes) contributes probably a little less than 3C of these 33C.
- The majority of these less than 3C of warming come for natural CO2 in the atmosphere. But a large portion of additional CO2 measured over the past 150 years stems from human causes… the exact net impact of these human CO2 emissions remains much debated in science
Either way, greenhouse gases logically impact the energy “balance” of our planet. Obviously, this “balance” is never in balance but changes all the time. The “balance” consists of short wave (visible light) radiation coming in and long-wave (mostly infrared) radiation going out… Prof Christy prepared the simple Figure 2 below giving you a glimpse. The balance is impacted by many many things, inc. but not limited to the position of Earth in relation to the Sun, Sun activity, Surface conditions on Earth inc. vegetation, Atmospheric conditions on Earth inc. cloud cover, Geological activity (vulcanos), and much more.
Energy into and out of Earth is often measured in Watts per m2, it sounds complicated, but it is not really… W/m2 just measures the energy radiating from Space to Earth and the other way around.
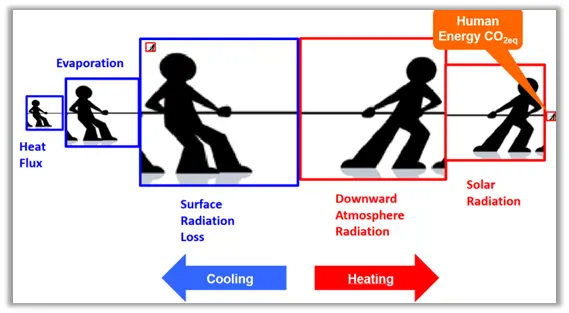
Figure 2: Illustrating cooling and heating radiation (Prof John Christy; Presentation Jan 2021)
Different greenhouse gases effect radiation at different bandwidths. As mentioned above, GHGs luckily limit outgoing energy or radiation. Actually, what GHGs do is delay the cooling by bouncing back and forth infrared (long-wave) radiation a few times, “leaving some energy with us”, before the remainder goes into space. Figure 3 below (explained in 3min in my video “Climate Impacts” starting at 2:35m until about 5:30m, exact link inc timing https://youtu.be/9Cu4NMu0jw0?t=154) gives you a hint about the different bandwidths where greenhouse gases impact the outgoing radiation from Earth. Again, H2O is all over the place
- We can see that CO2 is active in a limited bandwidth of 12-18 microns that is essentially saturated and explains why with increasing CO2 concentrations the resulting warming logarithmically declines
- We can also see that a doubling of CO2 would retain maybe 3 W/m2 (about 1% of today’s total 277 W/m2 that radiate to space)

Figure 3: Outgoing radiation by Profs Wijngaarden/Happer Nov 2019; download
Figure 4 below makes it even clearer. Left in red is incoming radiation; right in blue is outgoing radiation. You can see how much absorption and scattering is caused by water vapor (the grey areas below the graph)…. clearly the vast majority

Figure 4: spectral bands in which greenhouse gases effect incoming and outgoing radiation, Atmospheric Transmission – Wikipedia
On Clouds
Now that we have this basic understanding, lets talk about clouds (or water droplets). Water vapor and water droplets are all around us in form of clouds, rain, snow, hail, fog, and more. About 2/3rds of the world is covered in clouds at any given time (usually 60-70%). We are also reminded of the importance of water when we consider that 70% of the world is covered with oceans. Water vapor has the unique property that it condenses, or changes phase from gaseous to liquid and vice versa at temperatures that change with pressure or altitude (at the surface usually at 100C). Water also freezes.
Water vapor and water droplets (clouds) are far more effective in absorbing radiation to and from Earth than lower concentration, non-condensable carbon dioxide and other GHGs. Clouds are visible water vapor consisting of droplets. Figure 5 below illustrates to you the complexity of clouds and how many different forms of clouds they are.
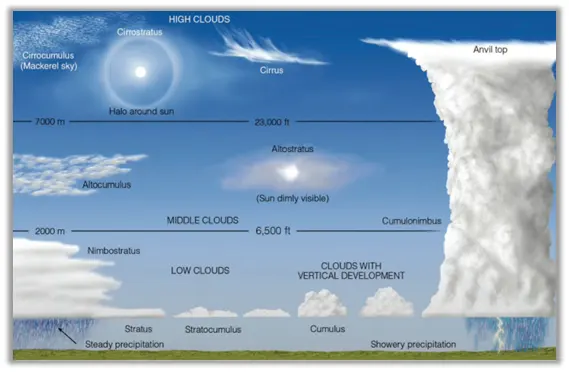
Figure 5: illustrating different clouds in our atmosphere
Unsurprisingly, as cloud cover increases, temperatures tend to drop. Clear skies in the summer over long periods give us a hot summer (see right now in Europe). In winter, however, it is often the opposite. More clouds mean warmer temperatures as the clouds appear to “retain” the heat closer to the surface.
- We differentiate between low clouds (tend to cool), and higher clouds (tend to warm), its unfortunately all not so simple
Why does solar activity impact cloud cover? Well, Prof Shaviv has covered this. More solar activity causes decrease in cosmic rays, this leads to a decrease in large aerosols (particles) in the atmosphere, which leads to a decrease in cloud cover (clouds need little particles to form), which increases the energy budget of Earth by 2-3+ W/m2 within a few days after the additional solar activity. On a side note… dirtier air (more particles) tends to form more clouds = colder, cleaner air (less particles) tends to form less clouds = warmer… now here is a problem for any clean air act that will cause more warming :).
- Compare that to a doubling of CO2 which would cause 3 W/m2 “more” energy on Earth… this tells you how quickly the energy balance can change based on natural phenomena
- Fyi, the IPCC assumes that “natural” changes only contributed 0,01 W/m2 to the energy budget between 1750 to 2019, which appears to be questionable at least (New study confirms Sun/Cosmic-Ray climate connection)
We know from our own experience that a cloudless day results in day temperatures 5-10C warmer than on a cloudy day. The main difference in temperature between a cloudy day and a cloudless day is caused by clouds limiting the solar radiation that reaches our surface. In fact, a cloudless sky can have 10x the heating effect of all CO2 in the atmosphere.
- Daily night/day temperature swings are biggest during cloudless conditions.
- Cloudless deserts show largest swings in temperatures… a cloudless day in a desert can be around 40C, a cloudless night around -4C
- The highest temperature ever measured with modern instruments was recorded in the Death Valley on 10 July 1913 at about 57C (Wikipedia)… remember, this was surely not the highest ever, but simply the highest measured… because we only have “proxies”, such as ice-cores and tree rings or fossils, for temperatures before the thermometer was invented by Fahrenheit in 1714. Such proxies don’t give us a resolution hour by hour or day by day… therefore they cannot show us warmest or coldest days.
What is interesting is that that several scientific studies confirm that the global cloud cover has been decreasing over the past 4 decades (list of studies at end of newsletter). The Northern Hemisphere cloud cover is said to have reduced by over 6% causing over 5 W/m2 heating. See Figure 6 below.
- For comparison, IPCC attributes 2,3 W/m2 to all GHG, and 1,7 W/m2 to CO2 alone
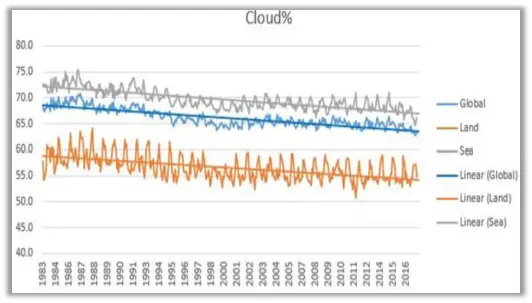
Figure 6: Cloud area 1983-2017 – global, over land, and over sea. Linear 1983-2017 change is -7.3% globally, -7.5% over land, -7.3% over sea, from Jonas 2022
The peer-reviewed paper Jonas 2022 concluded: “The patterns of behavior of clouds, both for cloud area and cloud opacity, indicate that the decrease in global cloud area over the study period 1983-2017 was caused by an unspecified factor and was not caused directly or indirectly by the global surface temperature increase over the same period. This also implies that the decrease in global cloud area was not caused by a man-made increase in CO2.”

Figure 7: Cloud Cover and surface temperatures, from Prof Geoff Duffy
On Climate models
Now one last point. Climate models are NOT capable of modeling clouds. Their resolution is too low and clouds are too complex. Now it starts to make sense why future climate predictions based on climate models are so unhelpful and show far too much warming (Scafetta 2022)
A short 30p book by MIT educated, Japanese climate scientist, climate modeler, and cloud specialist Dr Nakamura Mototak explains this well (Amazon.com). Nakamura writes “gross model simplifications include:
- Ignorance about large and small-scale ocean dynamics
- A complete lack of meaningful representations of aerosol changes that generate clouds.
- Lack of understanding of drivers of ice-albedo (reflectivity) feedbacks: “Without a reasonably accurate representation, it is impossible to make any meaningful predictions of climate variations and changes in the middle and high latitudes and thus the entire planet.”
- Inability to deal with water vapor elements
- Arbitrary “tunings” (fudges) of key parameters that are not understood”
Remember, that the modeled climate impact in 2100 is based on “average” climate models that (a) are fed scenarios which are far from reality, that (b) use climate sensitivities which have proven to be too high, that (c) assume the world will not adapt, that (d) dismiss CO2’s undisputed fertilization effects, that (e) dismiss human’ non-GHG effects, and that (f) cannot explain climatic changes prior to 1850 because they largely dismiss natural variability.
- That they are not able to model clouds adds icing to the cake
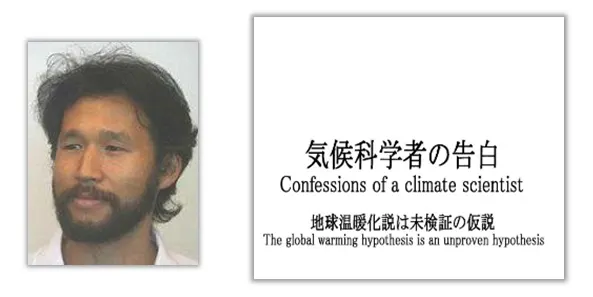
This is Dr Mototaka Nakamura, from Japan, details about him here
Selected Sources: Prof Geoff Duffy, Prof Happer, Prof Christy, Prof Shaviv, Prof Vahrenholt, Prof Svensmark, Coe, Prof. Lindzen, Prof Scafetta, and various others. Selected Research
- Coe et al 2021: The Impact of CO2, H2O and Other “Greenhouse Gases” on Equilibrium Earth Temperatures
- Duebal/Vahrenholdt 2021: Radiative Energy Flux Variation from 2001–2020
- Svensmark et al 2021: Atmospheric ionization and cloud radiative forcing
- Jonas 2022: Clouds independently appear to have as much or greater effect than man-made CO2 on radiative forcing
- Lindzen Choi 2021: The Iris Effect: A Review
- An excellent Video by Jim Steele: Big 5 Natural Causes of Global Warming part 5: How Clouds Moderate Global Warming – https://www.youtube.com/watch?v=tiQ6bLiWNmw
- Scafetta 2022, Avanced testing of climate models
