Autocorrelation in CO2 and Temperature Time Series
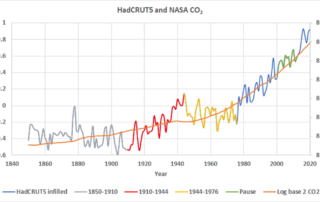
By Andy May In my last post I plotted the NASA CO2 and the HadCRUT5 records from 1850 to 2020 and compared them. This was in response to a plot posted on twitter by Robert Rohde implying they correlated well. The two records appear to correlate because the resulting R2 is 0.87. The least square’s function used made the global [...]


