By Andy May
As my regular readers know, I’ve been writing about the Holocene, especially Holocene climate, for over ten years. My colleagues, Javier Vinós and Renee Hannon, have also written extensively on this topic. This fills a void left by the IPCC, which ignores the Holocene, a fact made very clear in my last two posts, here and here. Here I would like to review a very comprehensive and informative review article of what the authors, Darrell S. Kaufman and Ellie Broadman, call “The Holocene global temperature conundrum.” The paper was published in Nature February 15, just a little over a week ago. I was made aware of it by a reader who identifies himself as “Mike G,” he was also kind enough to send me a pdf of the article.
Kaufman and Broadman define the Holocene Temperature Conundrum in this way:
“A landmark reconstruction of GMST showed peak warmth during the mid-Holocene, when GMST reached about 0.8 °C higher than that of the preindustrial period. By contrast, early transient climate modelling showed that GMST was around −0.5 °C colder during the mid-Holocene compared with preindustrial [aka Little Ice Age] temperature, followed by continued warming. This discrepancy between the late Holocene global cooling trend inferred from proxy evidence versus the warming trend simulated by climate models is known as the ‘Holocene temperature conundrum’”
(Kaufman & Broadman, 2023)
Thus, the proxy evidence we have suggests that the early Holocene global mean surface temperatures (GMST) were warmer than the Little Ice Age (aka the preindustrial period) by about 0.8°C, but the IPCC/CMIP6/PMIP4 climate models suggest that the early Holocene was cooler, by 0.3 to 0.5°C than the Little Ice Age.
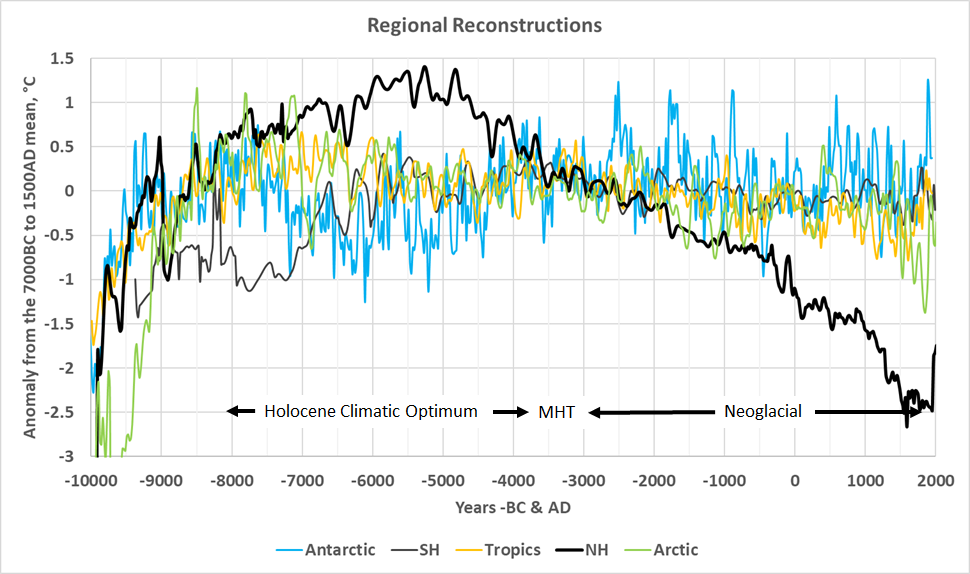
After exhaustively reviewing the evidence for temperature changes in the Holocene, Kaufman and Broadman conclude that global mean surface temperatures (GMST) were higher during the Holocene Climatic Optimum, and that subsequent global cooling took place over the following period often called the Neoglacial. Figure 1 is from my previous post, it provides reasonable regional temperature reconstructions for the Arctic, Northern Hemisphere, tropics, Southern Hemisphere, and Antarctica.

Figure 1. The regional temperature reconstructions shown are in 30° latitude slices, that is the Arctic (green line) is from 90°N to 60°N, the Northern Hemisphere (heavy black line) is from 60°N to 30°N, the tropics are from 30°N to 30°S, the Southern Hemisphere is from 30°S to 60°S and the Antarctic from 60°S to 90°S. The Holocene Climatic Optimum warm period, the Mid-Holocene Transition (MHT), and the Neoglacial Period are identified. Sources: (May, 2018, Chapter 4) and here
As Figure 1 makes clear it is difficult to accurately and honestly represent Holocene temperature changes with a “global average.” Early in the Holocene the different latitude slices go in different directions and the Neoglacial Period cooling is not truly global, but mostly in the Northern Hemisphere. None-the-less, Kaufman and Broadman conclude:
“GMST probably peaked sometime late during the first half of the Holocene, at roughly 6.5 ka [4500BC], as evidenced by extensive proxy data and supported by theory and models. Proxy evidence reported in several studies indicates that GMST was roughly 0.5 °C higher during this millennial-scale period compared with 1850–1900, with most of the warming occurring at middle to high latitudes in the Northern Hemisphere.”
(Kaufman & Broadman, 2023)
Thus, the data runs opposite the models. When I was a computer modeler, this was the end of it, sorry buddy, you blew it. But we live in a different world today. The authors go on to say:
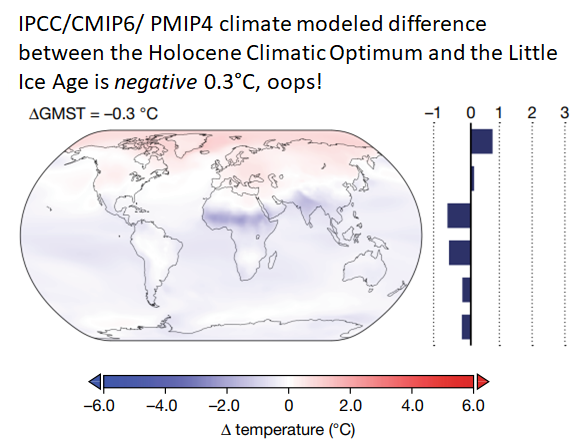
“On the modelling side, none of the 16 latest-generation global climate models that participated in the recent CMIP6-PMIP4, 6-ka experiment simulated GMST that exceeded their preindustrial control runs. GMST at 6 ka in these models averaged 0.3 °C cooler than the preindustrial period (Fig. 1b), arguing against a global HTM.”
(Kaufman & Broadman, 2023)
They provide a plot of the CMIP6 modeled temperature difference between the Holocene Climatic Optimum (HCO) and the Little Ice Age (LIA). It is our Figure 2.

Figure 2. The difference between CMIP6/PMIP4 climate model temperatures during the Holocene Climatic Optimum and the Little Ice Age. The models hindcast that the Little Ice Age was warmer by 0.3°C, on average, than the Holocene Climatic Optimum. This is against all proxy evidence and all historical records
The map of climate model results in figure 2 is damning enough, but the histogram to the right suggests that the middle Northern Hemisphere latitudes were nearly the same in the HCO and the LIA! We know that cannot be correct. Numerous historical, proxy, and archaeological records from around the world show that the LIA was the coldest and most miserable time in human history in the Northern Hemisphere.
Kaufman and Broadman conclude:
“If our preferred interpretation [the HCO was warmer than the LIA] is correct and recent global warming was proceeded by a multimillennial global cooling trend, then this points to the need to improve our understanding of natural climate forcings and feedbacks, along with their representation in climate models. The very large seasonal and latitudinal changes in insolation caused by orbital forcing is the most likely instigator of climate feedbacks over the second half of the Holocene.”
(Kaufman & Broadman, 2023)
All I have to say is “hear! hear!” Climate models are clearly not modeling natural climate change accurately, especially not orbital forcing. If you cannot model natural climate change, you have no idea what the human influence on climate is. If you cannot model the Holocene correctly, you don’t understand climate change.
Works Cited
Kaufman, D., & Broadman, E. (2023, February 15). Revisiting the Holocene global temperature conundrum. Nature, 614, 425-435. Retrieved from https://doi.org/10.1038/s41586-022-05536-w
