“Are my works wrong for several reasons?”
Professor Demetris Koutsoyiannis has written a reaction to Michel Thizon’s earlier article on anthropic CO2.

I am grateful to Clintel for reposting almost all of my Climath posts. I also welcome Clintel’s posting of an article criticizing my findings (hereafter “Comment”). This is authored by Michel Thizon (hereafter “Commentator”) and is entitled “Anthropic CO2, the real %”. Clintel presents it with the following introduction [bold in the original]:
Michel Thizon, a retired CNAM Paris engineer and former researcher at Ecole Polytechnique, has written a reaction to the research by Professor Demetris Koutsoyiannis, who argues that rising CO₂ levels are not the cause of global warming but its consequence (see for instance this article and YouTube video). Thizon writes: “Based on the measured 13C levels of atmospheric CO2, some have hypothesized that anthropic CO2 from fossil fuel combustion only represents 4 to 6% of atmospheric CO2. They thus conclude that human intervention is minor in the increase in atmospheric CO2. This is wrong for several reasons.”
Receiving criticism from climate sceptics, including Clintel signatories, is no surprise to me. In fact, most of the criticism I have received for my work has come from what I call “mainstream climate sceptics”. (The climalarmists behave differently—they try to force journals to reject or retract my papers).
Before discussing the “several reasons” for which my works on climate1 are criticized as being wrong, I would like to present my thoughts on the “several reasons” that might possibly cause mainstream climate sceptics to criticize the works of mine and other authors, which challenge the established narrative about atmospheric CO₂:
- My works (and other similar ones) are wrong. This is certainly a possibility, but I have been publishing works on climate for years and, despite the intensive efforts of many to tear them down, no error has yet been found.
- As I wrote in my introductory Climath post, given the extent of the climandate (political) agenda, one may assume that it also includes climoles, who present themselves as climate sceptics, while serving the agenda.
- Mainstream sceptics struggle to prove that they are “reasonable guys”, distancing themselves from the “bad guys” who tend to dispute the entire narrative.
- Mainstream sceptics, similar to climalarmists, are human and prefer the easy (or lazy) path of using established stereotypes rather than thinking. By avoiding thinking, they also become susceptible to several common biases.
One of the common biases, which I refer to below, is the so called “streetlight effect”, and is explained in the cartoon below. (See also: (a) The “Streetlight Effect”: a metaphor for knowledge and ignorance; (b) Let There Be (More) Light: The Case for Impact Evaluations; (c) “Did You Lose the Keys Here?” “No, But the Light Is Much Better Here”.)
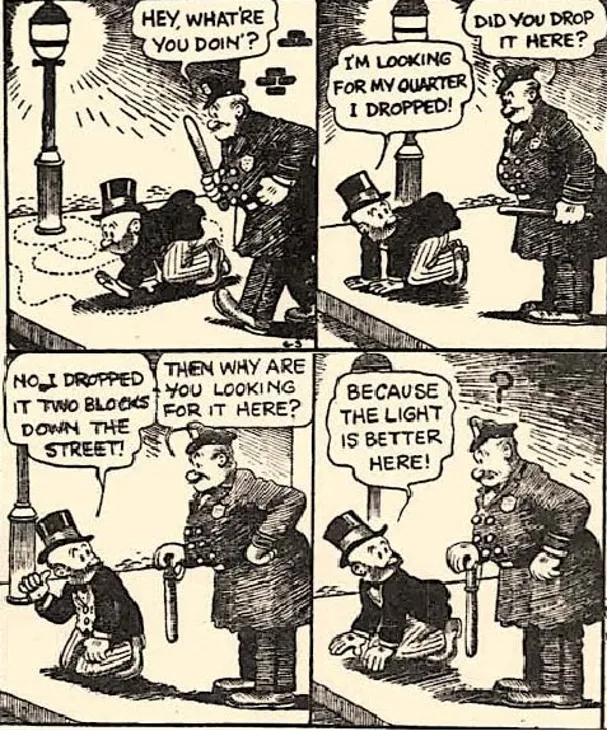
Original source: Florence Morning News, 1942-06-03, Mutt and Jeff Comic Strip, Page 7, Florence, South Carolina; retrieved and adapted from Australian study of fluoridation neurotoxicity: Streetlight Effect Fallacy.
Of course, more than one of the “several reasons” for criticizing what challenges the established narrative can be relevant in each case. In the case of Michel Thizon’s Comment, there is evidence that the last reason (lazy path of using established stereotypes) is present. Specifically:
- The Commentator has not read my papers which he criticizes. Had he read them, he would be specific (e.g. talking about mistakes he thought they contain), rather than repeating common and general stereotypes. Furthermore, he would have seen in my papers that what he supports is not valid. (Below, I will give examples.)
- The material he gives, is copied from an earlier (anonymous) web post, namely “Le CO2 pas si coupable que çà !”. This was done without providing a link to the original. All graphs are copied from there except for one, which is copied from another site, which he cites (NZCPR Site, Carbon Dioxide is a “Short Lived“ Gas).
- Some of the graphs are old, and have not been updated with recent data. The graph labelled “Cumulative in Gigatones since 1965” ends in 2015, leaving out ten years of data. The graph labelled “disappearance rates of radioactive carbon” ends before 1995 leaving out more than 30 years of data. There exist updated graphs even in my own papers, which the Commentator could have seen and used if he had read my papers before reacting to them.
In his first point the Commentator includes a graphic entitled “Variations over 400,000 years”, which, obviously, is not a copy of my figure below, but a copy from the aforementioned site.
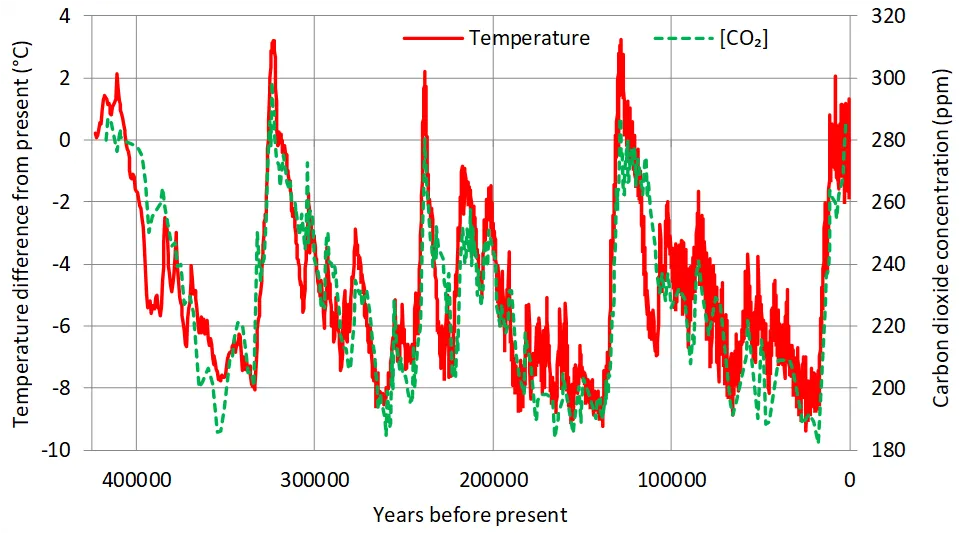
Figure 4 of my paper #13 in footnote 1. Time series of temperature and CO₂ concentration from the Vostok ice core, retrieved, respectively, from http://cdiac.ess-dive.lbl.gov/ftp/trends/temp/vostok/vostok.1999.temp.dat and from http://cdiac.ess-dive.lbl.gov/ftp/trends/co2/vostok.icecore.co2
Commentator’s copy contains, in addition to the two time series also shown in my figure, some zigzag trendlines which presumably show that:
a temperature variation of 1°C leads to an increase in natural CO2 of only about 8 or 10 ppmv.
Had the Commentator read my paper #13 in footnote 1, he would perhaps have noticed that drawing such trendlines or focusing on the succession of peaks and troughs can produce misleading results, as shown in Figure 8 of my paper #13 copied below.
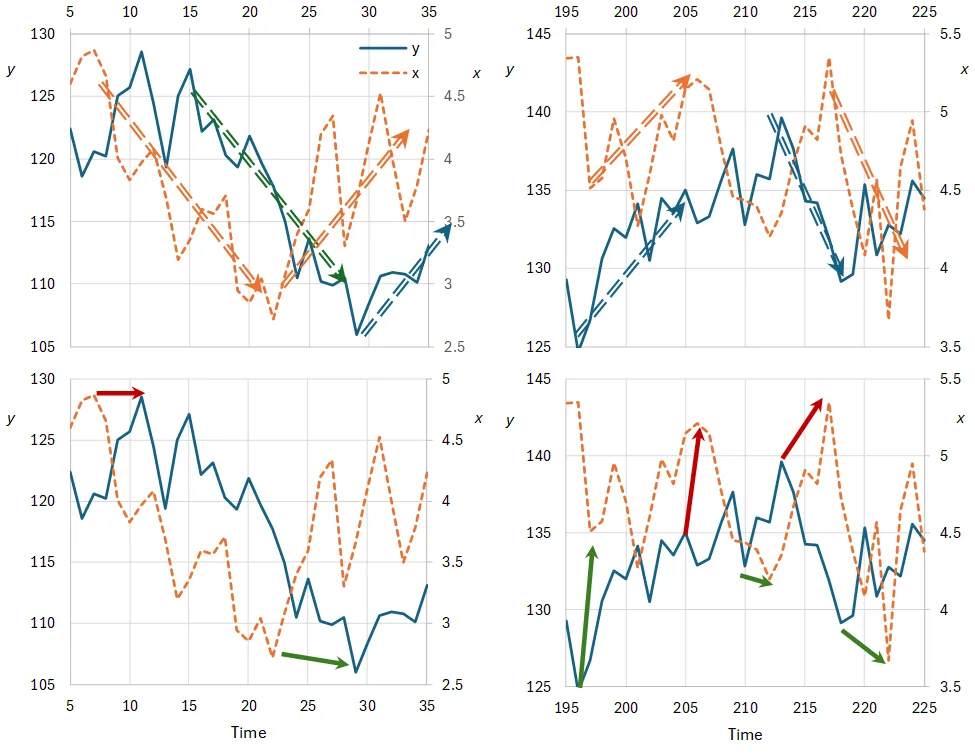
Figure 8 of my paper #13 in footnote 1. Two groups of consecutive values of time series from a causal system x_τ → y_τ, each consisting of 30 items, for illustrating the inappropriateness of a deterministic approach that looks for “phasing” in time series through (upper) trends, visualized as dashed double-line arrows with same color as the time series they refer to, and (lower) peaks and troughs, with successions visualized by red and green arrows, respectively. (left column) A group of 30 terms preserving the correct time precedence of x_τ over y_τ; (right column) a group of 30 terms incorrectly suggesting the reverse time precedence
What is needed in a scientific approach is a stochastic method that can identify in a reliable manner the cause and the effect, and infer the related time lag. That stochastic method is developed in several of my papers (#4, #6, #7, #10, #13) and is based on the concept of the Impulse Response Function (IRF). Application of the method to the Vostok data discussed by the Commentator, is given in Figure 15 of my paper #13 in footnote 1, which is also copied below.
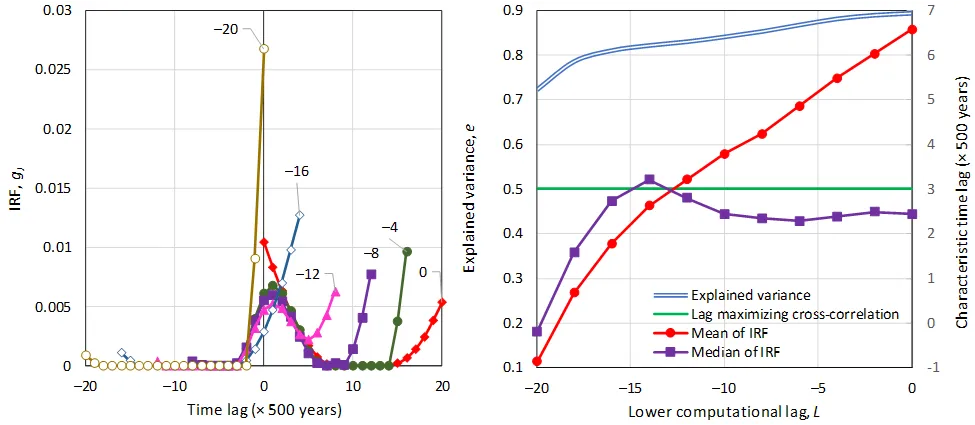
Figure 15 of my paper #13 in footnote 1 (part). Application of the methodology to the late Quartenary (Vostok) data: Original series of 200 000 years with time step of 500 years; (left) Estimated IRFs for the indicated lower computational lag, L (marked at the high end of each curve); (right) explained variance and characteristic time lags as functions of the lower computational lag.
The shapes of the IRFs for different lower computational lags L and the fact that the explained variance is an increasing function of L suggest a causal system with temperature as the cause and [CO₂] as the effect. The time lags between the cause and the effect ranges as shown in the curve labelled “0” in the left panel and has a median of 1200 years and a mean of 3300 years (right panel for L = 0).
By reading my papers, the Commentator would perhaps have avoided using the quantification “ 8 or 10 ppmv” per °C in his phrase displayed above. For the temporal resolution of the CO₂ Vostok data is of the order of 500-1000 years and this performs smoothing of the annual or sub-annual values. It is totally incorrect to use values determined from a 1000-year scale as if they were relevant to the annual scale. This effect has been studied in my paper #13 in footnote 1, using very long time series of measurements, namely from laboratory experiments of turbulent velocity, measured at a high frequency, so that very large samples be formed.
As seen in Figure 7 of that paper, reproduced below, while the shape is rough in the fine-scale series, that in the coarse-scale series tends to be flat. Some small variability continues to appear at the coarse scale, but this is due to the Hurst-Kolmogorov dynamics. The deformation is worse in the case of averaging, which is more appropriate for climate proxies, because of the diffusion that occurs, particularly when the proxies originate from ice cores.2 Actually, the situation in ice cores can be even worse than seen in Figure 7, as the diffusion time scale could be even coarser than the nominal time averaging time scale.
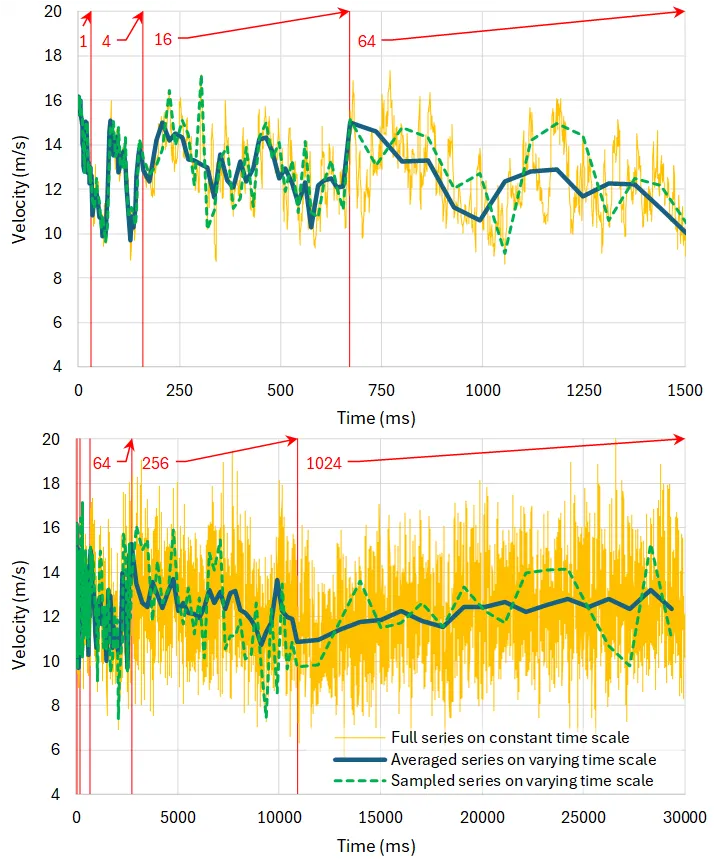
Figure 7 of my paper #13 in footnote 1. A long turbulent velocity time series, plotted for varying time scales, from 1 to 1024 ms, with each increased one being a quadruple of the immediate smaller time scale; (upper) the first 1500 terms; (lower) 30 000 terms. The information in red, followed by the arrows, is the scale of data aggregation.
Quantification of how the dispersion decreases for increasing time scale of averaging is provided in the graph below (from my recent presentation3, based on the turbulent velocity time series). For instance, the maximum distance from mean at scale 1 ms is 8 times higher than that at scale 1024 ms. Hence, values determined for a scale of 1 time unit could be almost an order of magnitude higher than those determined for a scale of 1000 time units.
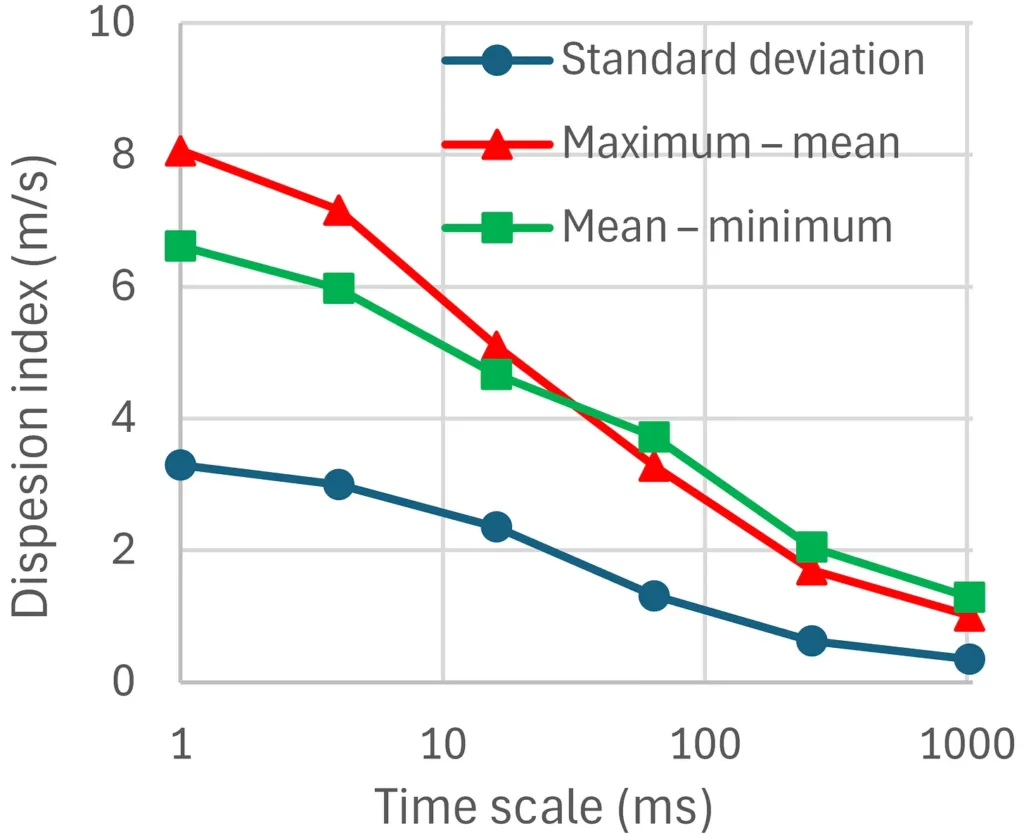
Dispersion indices of the turbulent velocity time series Source: Slide 61 of my presentation in footnote 3.
The second point made by the Commentator is reflected in this quotation from the Comment:
It can certainly be noted that carbon emissions and fluxes in nature are not limited to CO₂ from human combustion, but the ‘baseline’ of CO₂ measured was at a natural equilibrium level before this human intervention and corresponds to a constant.
This is indeed a very interesting formulation: it says that there are some other CO₂ emissions, additional to those from human combustion…. What the Commentator hides is that these other additional emissions are the 96% of the total, while those he emphasizes are the 4% of the total.
The formulation “‘the ‘baseline’ of CO₂ measured was at a natural equilibrium level before this human intervention and corresponds to a constant” is totally wrong, even though it is fully consistent with IPCC’s AR6 assertion (2021, p. 54):4
Emissions from natural sources, such as the ocean and the land biosphere, are usually assumed to be constant, or to evolve in response to changes in anthropogenic forcings or to projected climate change.
Never was the CO₂ or any other process on Earth constant. This concerns the geological past, as well as the modern period. In my paper #14 in footnote 1, I have quantified in detail the changes in natural CO₂ emissions in the recent decades and in paper #17 I have summarized the findings of the other papers.
The graph below, based on the results of my paper #14 in footnote 1, uses the Commentator’s convention to take cumulative values of CO₂ quantities from 1965. The rectangle close to the horizontal axis is what the Commentator presents in his own (?) graph. The reasons that he chose only this part and plotted only two of the curves shown in my graph seem to be that the “global CO₂ production is very precisely calculated by British Petroleum and other organizations” and that changes in atmospheric CO₂ content can be inferred from the Mauna Loa recordings. This is exactly the “streetlight effect” I mentioned in the beginning of the post. In the best case, he focuses on the 4% of the total because “the Light Is Much Better Here”. (I avoid mentioning other possible “several reasons” additional to this).
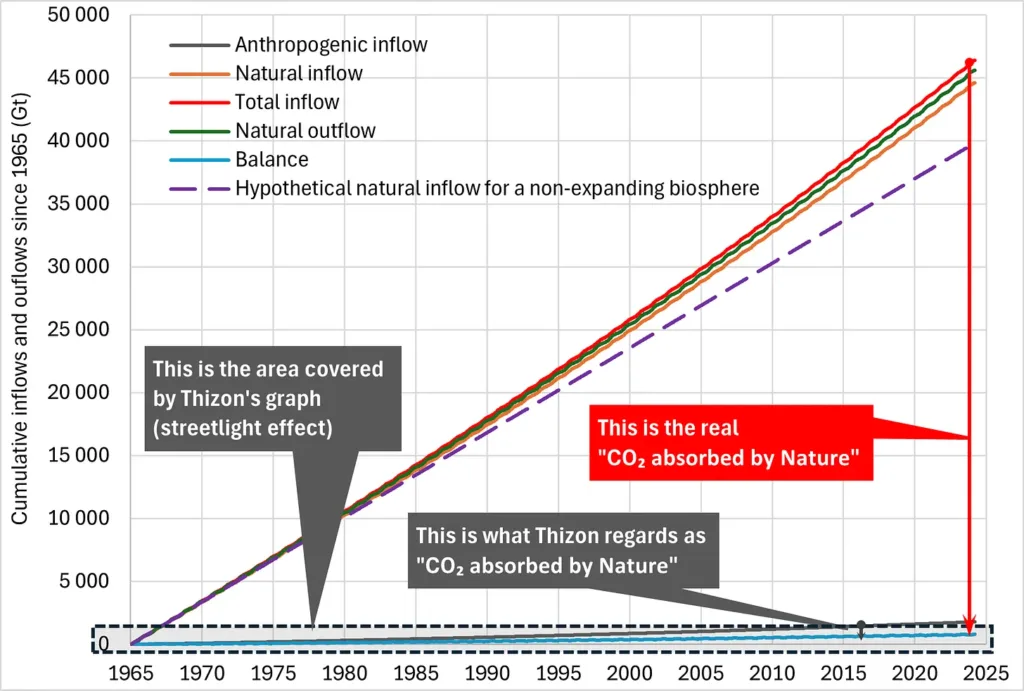
The above graph also shows the hypothetical case where the natural emissions were constant, equal to the rate corresponding to the 5-year period 1965-70. The difference from constancy seen in the graph is substantial. A better depiction is provided by the following graph, taken from my paper #17 in footnote 1. It is clearly seen that the increase of the natural emissions is almost five-fold (=26.1/5.4) in comparison to the most recent estimate of human emissions. And this is the result of the expansion of the biosphere caused by temperature increase. And the total natural emissions are about twenty times (= 110.5/5.4) more than the most recent estimate of human emissions.
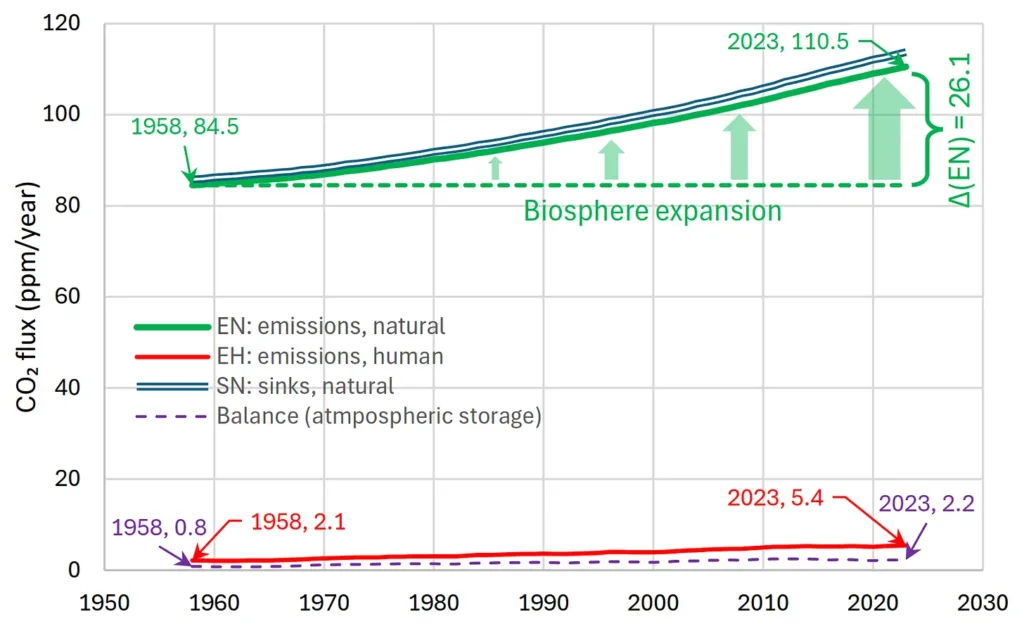
Figure 4 of paper #17 in footnote 1. CO₂ fluxes in the atmosphere for the period 1958-2023, as inferred by human emission estimates, CO₂ concentration data, and the model by Koutsoyiannis (paper #14 in footnote 1) (for EN and SN).
The third and last point is related to carbon’s isotopes. Again my impression is that he did not read my papers #12, #15 and #17, related to this issue. In the beginning of his Comment, he includes the following statement related to that issue:
Plants absorb relatively less 13C than 12C. Thus, fossil fuels from the plant world (natural gas, oil, coal) have less 13C than in nature (carbonate rocks for example). Their combustion produces CO₂ that is relatively depleted in 13C.
It appears that the Commentator did not understand that the first sentence in this statement annuls the remaining part. It is correct that plants absorb relatively less ¹³C than ¹²C, in comparison to the abundances thereof in the atmosphere. But this means that they also emit less ¹³C than ¹²C. While fossil fuels have indeed a small δ¹³C signature, down to –26‰, and hence their input is low, C3 plants (e.g., evergreen trees, deciduous trees and weedy plants) have much lower δ¹³C values than fossil fuels, down to –34‰, and thus their input is even lower. Lower values than in fossil fuels, also appear in other CO₂ sources. These values are shown in the graph below, copied from my paper #15 in footnote 1.
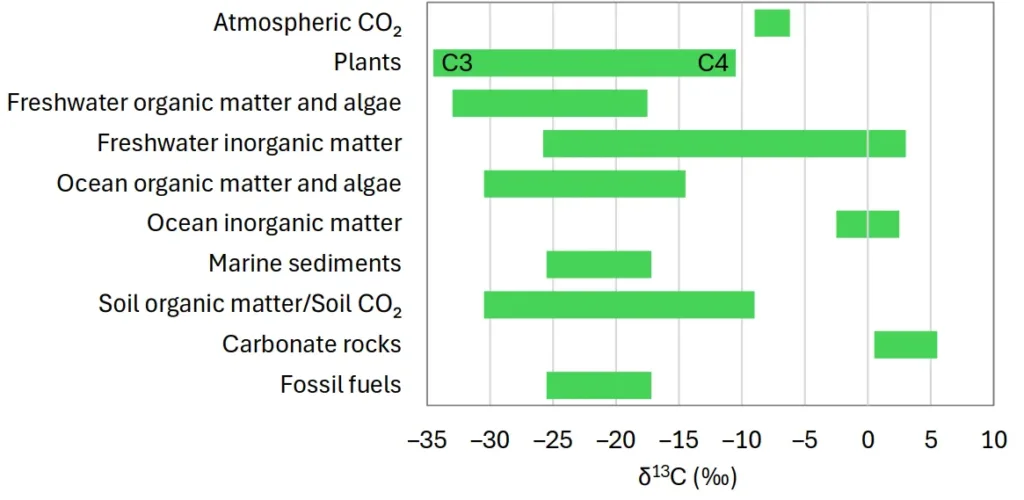
Figure 2 of my paper #15 in footnote 1. Ranges of δ¹³C values for common carbon reservoirs.
When the C3 plants (and many other organisms) respire, they emit to the atmosphere low δ¹³C input, decreasing the atmospheric δ¹³C content. It is therefore absurd to suggest that it is the emission from burning fossil fuels (4% of the total) that causes the atmospheric δ¹³C value to fall. And, as already said, it is the expansion of the biosphere that caused the additional natural emissions, rather than Henry’s law invoked by the Commentator.
Furthermore, my paper #12 in footnote 1 fully reproduced the δ¹³C observations with a simple model, which disregards the minor part of human emissions. The agreement of the model with observations is perfect, as seen in the graph below reproduced from this paper.
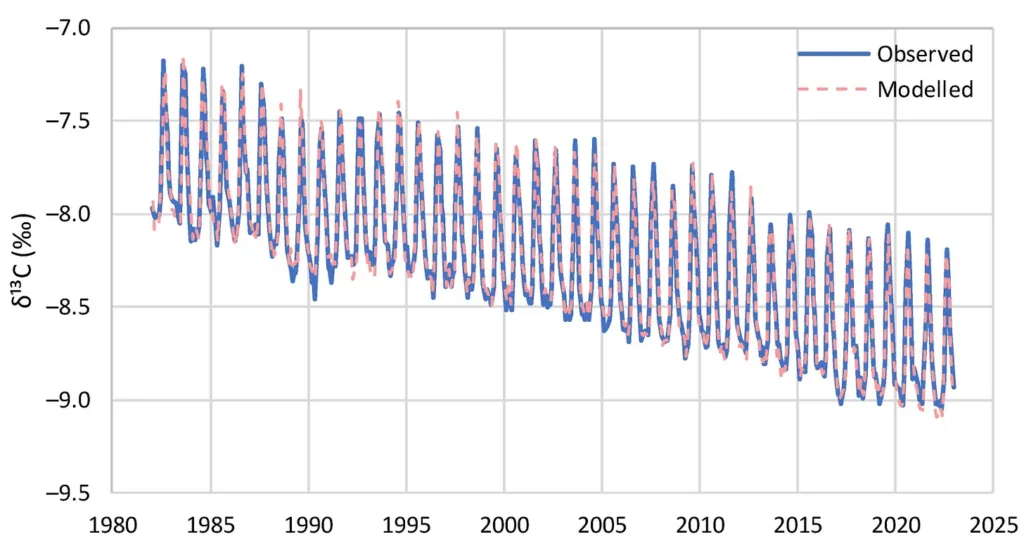
Figure 16 of paper #12 in footnote 1 (part). Model reproduction of the monthly observations of evolution of δ¹³C at Barrow.
No decrease in the signature of incoming δ¹³C is observed. The decrease in atmospheric content of δ¹³C is due to the increased CO₂ concentration mostly due to biosphere’s increased emissions. A constant net input signature of δ¹³C of slightly less than –13‰ at an overannual time scale is representative across the entire globe for the entire period of measurements. The same value holds for the entire period after the Little Ice Age, as confirmed by proxy data. These results support the conclusion that natural causes drove the increase of CO₂ concentration. A human-caused signature (Suess effect) is non-discernible.
So, these are the Commentator’s three points—or “several reasons”—for opposing my papers. None of them is valid.
Copying (and updating) from my post A quick overview of my recent works on climate, in the last five years alone I have produced the following climate-related works (in collaboration with the coauthors mentioned or alone), in chronological order (including my book):
- D. Koutsoyiannis, Revisiting the global hydrological cycle: is it intensifying?, Hydrology and Earth System Sciences, 24, 3899–3932, doi:10.5194/hess-24-3899-2020, 2020.
- T. Iliopoulou and D. Koutsoyiannis, Projecting the future of rainfall extremes: better classic than trendy, Journal of Hydrology, 588, doi:10.1016/j.jhydrol.2020.125005, 2020.
- Z.W. Kundzewicz, I. Pińskwar and D. Koutsoyiannis, Variability of global mean annual temperature is significantly influenced by the rhythm of ocean-atmosphere oscillations, Science of the Total Environment, 747, 141256, doi:10.1016/j.scitotenv.2020.141256, 2020.
- D. Koutsoyiannis and Z.W. Kundzewicz, Atmospheric temperature and CO₂: Hen-or-egg causality?, Sci, 2 (4), 83, doi:10.3390/sci2040083, 2020.
- D. Koutsoyiannis, Rethinking climate, climate change,and their relationship with water, Water, 13 (6), 849, doi:10.3390/w13060849, 2021.
- D. Koutsoyiannis, C. Onof, A. Christofides and Z.W. Kundzewicz, Revisiting causality using stochastics: 1.Theory, Proceedings of The Royal Society A, 478 (2261), 20210835, doi:10.1098/rspa.2021.0835, 2022.
- D. Koutsoyiannis, C. Onof, A. Christofides and Z.W. Kundzewicz, Revisiting causality using stochastics: 2. Applications, Proceedings of The Royal Society A, 478 (2261), 20210836, doi:10.1098/rspa.2021.0836, 2022.
- D. Koutsoyiannis and A. Montanari, Climate extrapolations in hydrology: The expanded Bluecat methodology, Hydrology, 9, 86, doi:10.3390/hydrology9050086, 2022.
- D. Koutsoyiannis, T. Iliopoulou, A. Koukouvinos, N. Malamos, N. Mamassis, P. Dimitriadis, N. Tepetidis and D. Markantonis, In search of climate crisis in Greece using hydrological data: 404 Not Found, Water, 15 (9), 1711, doi:10.3390/w15091711, 2023.
- D. Koutsoyiannis, C. Onof, Z.W. Kundzewicz and A. Christofides, On hens, eggs, temperatures and CO₂: Causal links in Earth’s atmosphere, Sci, 5 (3), 35, doi:10.3390/sci5030035, 2023.
- D. Koutsoyiannis and C. Vournas, Revisiting the greenhouse effect—a hydrological perspective, Hydrological Sciences Journal, 69 (2), 151–164, doi:10.1080/02626667.2023.2287047, 2024.
- D. Koutsoyiannis, Net isotopic signature of atmospheric CO₂ sources and sinks: No change since the Little Ice Age, Sci, 6 (1), 17, doi:10.3390/sci6010017, 2024.
- D. Koutsoyiannis, Stochastic assessment of temperature – CO₂ causal relationship in climate from the Phanerozoic through modern times, Mathematical Biosciences and Engineering, 21 (7), 6560–6602, doi:10.3934/mbe.2024287, 2024.
- D. Koutsoyiannis, Refined reservoir routing (RRR) and its application to atmospheric carbon dioxide balance, Water, 16 (17), 2402, doi:10.3390/w16172402, 2024.
- D. Koutsoyiannis, Definite change since the formation of the Earth [Reply to Kleber, A. Comment on “Koutsoyiannis, D. Net isotopic signature of atmospheric CO2 sources and sinks: No change since the Little Ice Age. Sci 2024, 6, 17”], Sci, 6 (4), 63, doi:10.3390/sci6040063, 2024.
- D. Koutsoyiannis, Relative importance of carbon dioxide and water in the greenhouse effect: Does the tail wag the dog?, Science of Climate Change, 4 (2), 36–78, doi:10.53234/scc202411/01, 2024.
- D. Koutsoyiannis, The relationship between atmospheric temperature and carbon dioxide concentration, Science of Climate Change, 4 (3), 39–59, doi:10.53234/scc202412/15, 2024.
- D. Koutsoyiannis and T. Iliopoulou, Understanding Climate: Gifts from the Nile, 60 pages, SR 301, The Heritage Foundation, Washington, DC, USA, 2024.
- D. Koutsoyiannis, Stochastics of Hydroclimatic Extremes – A Cool Look at Risk, Edition 4, ISBN: 978-618-85370-0-2, 400 pages, doi:10.57713/kallipos-1, Kallipos Open Academic Editions, Athens, 2024.
- T. Iliopoulou and D. Koutsoyiannis, Have rainfall patterns changed? A global analysis of long-term rainfall records and re-analysis data, 46 pages, SR 306, The Heritage Foundation, Washington, DC, USA, 2025.
- D. Koutsoyiannis, When are models useful? Revisiting the quantification of reality checks, Water, 17 (2), 264, doi:10.3390/w17020264, 2025.
J. Ahn, M. Headly, M. Wahlen, E. J. Brook, P. A. Mayewski, K. C. Taylor, CO₂ diffusion in polar ice: observations from naturally formed CO₂ spikes in the Siple Dome (Antarctica) ice core, Journal of Glaciology, 54, 685-695, 2008.
IPCC (Intergovernmental Panel on Climate Change), Climate Change 2021: The Physical Science Basis. Contribution of Working Group I to the Sixth Assessment Report (AR6) of the Intergovernmental Panel on Climate Change; ed. by Masson-Delmotte, V., Zhai, P., Pirani, A., Connors, S.L., Péan, C., Berger, S., Caud, doi: 10.1017/9781009157896, 2021.

more news

Matt Ridley thinks the Climate Parrot is almost dead
In his recent ICSF/Clintel lecture, Matt Ridley argued that public and political momentum behind the “climate emergency” narrative is weakening, and he explored the reasons for this shift as well as its implications.
TOA EEI versus Surface Net Flux
Explore how climate scientist Andy May analyzes the relationship between TOA energy imbalance and surface net flux, challenging common interpretations in climate science.

Met Office temperature measurements unreliable and systematically biased
The article below by Chris Morrison clearly demonstrates that the reliability of temperature measurements in the United Kingdom is seriously lacking. Based on detailed research, Dr Eric Huxter shows that a large share of recorded temperature spikes is not the result of natural variation, but of artificial influences at poorly located measurement stations. This raises fundamental questions about the quality of the underlying data used for climate reporting and policy decisions.

