CO2 will barely double in 2100
By Roy W. Spencer, Ph. D. reposted from his blog
The simple CO2 budget model I introduced in 2019 is updated with the latest Mauna Loa measurements of atmospheric CO2 and with new Energy Information Administration estimates of global CO2 emissions through 2050. The model suggests that atmospheric CO2 will barely double pre-industrial levels by 2100, with a total radiative forcing of the climate system well below the most extreme scenario (RCP8.5) used in alarmist literature (and the U.S. national climate assessment), with the closest match to RCP4.5. The model also clearly shows the CO2 reducing effect of the Mt. Pinatubo eruption of 1991.

Clintel Foundation
Date: 20 July 2022
The Model
As described here, the simple CO2 budget model uses yearly sources and sinks of atmospheric CO2 to compute how much the atmospheric CO2 concentration changes from one year to the next.
The sink (removal) of “excess” atmospheric CO2 assumes that all of the biological and geophysical processes that remove CO2 from the atmosphere do so at a net rate proportional to the excess of the CO2 value above some ‘equilibrium’ value. When the model is calibrated with the yearly Mauna Loa CO2 data from 1959 through 2021, this rate of removal is 2.02% of the atmospheric excess above 294 ppm. So, for example, at the current CO2 concentration of 417 ppm, the biological and geophysical removal processes are removing 0.0202 x [417 – 294] = 2.48 ppm per year for 2022 (preliminary estimate).
The long-term source of CO2 increase is assumed to be anthropogenic. There are various estimates of yearly CO2 emissions, some from energy use alone, some including cement production and land use. I’ve used the Boden et al. (2017) and Our World in Data yearly estimates for 1750 through 2009, and EIA.gov estimates of yearly emissions growth rates from 2010 to 2050, and then assumed their 2050 growth rate is constant to 2100.
I also have included an ENSO term (El Nino and La Nina) to empirically account for CO2 rising during El Nino and decreasing during La Nina. This term amounts to 0.45 times the Multivariate Enso Index (MEI) value averaged from May of the previous year through April of the current year. For example, the latest yearly-average MEI value is -1.29 (La Nina conditions), so 0.45 x [-1.29] =Â -0.58 ppm CO2 decrease in 2022 from La Nina activity.Â
The model is initialized in 1750. The MEI data are included starting in 1958-59.
Results
The model fit to Mauna Loa CO2 data is shown in Fig. 1. Note that the largest discrepancies between model and observations are due to major volcanic eruptions, especially Mt. Pinatubo in 1991.
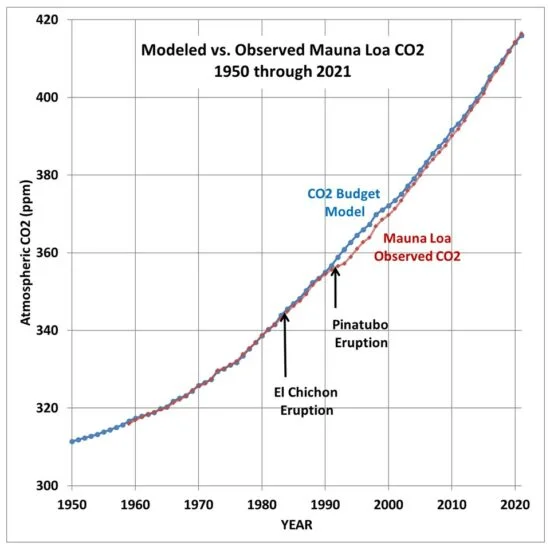
Fig. 1. Model versus observed CO2 concentrations at Mauna Loa, HI.
Contrary to popular perception, these eruptions actually remove CO2 from the atmosphere. This is likely due to increased photosynthesis due to a large increase in diffuse solar radiation from the sky, from sunlight scattered by volcanic aerosols, which can penetrate deeper into vegetation canopies.
When we run the model using 2021 EIA estimates of yearly CO2 emissions increases from 2010 through 2050, and then assuming the 2050 increase remains the same to 2100, the resulting atmospheric CO2 scenario is closest to the IPCC RCP4.5 scenario. The model CO2 concentration barely reaches the 2XCO2 level, a doubling of the pre-industrial CO2 level.
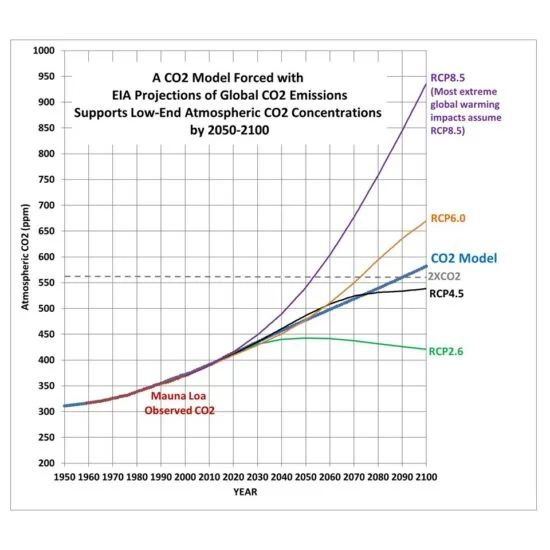
Fig. 2. As in Fig. 1, but extended to 2100, with the various IPCC radiative forcing scenarios used in recent IPCC reports.
Note the model is well below the RCP8.5 scenario, which is the one most often used to promote alarmist projections of sea level rise, temperature increase, etc. The weaker the future radiative forcing from increasing CO2, the weaker resulting climate change will be.
Discussion
Climate model projections depend critically upon how much atmospheric CO2 will rise in the future. That, in turn, depends upon (1) future anthropogenic emissions, and (2) how fast nature removes “excess” CO2 from the atmosphere.
A simple budget model of the atmospheric CO2 concentration very accurately matches the Mauna Loa CO2 data during 1959-2021 using yearly estimates of global anthropogenic CO2 emissions as a CO2 source, and the observed average rate of removal of CO2 by biological and physical processes, which is proportional to the “excess” of atmospheric CO2 over a baseline of 295 ppm as a sink. An empirical factor to account for El Nino and La Nina activity is also included, which mostly affects year-to-year fluctuations in CO2.
The resulting model projection produces atmospheric CO2 concentrations late this century well below the IPCC RCP8.5 scenario, and even below the RCP6.0 scenario. This suggests that the most dire climate change impacts the public hears about will not happen. Note that this likely reduction in future global warming impacts is in addition to the evidence that the climate system is not as sensitive to increasing CO2 as is claimed by the IPCC. In other words, future climate change will likely be much weaker than projected due not only to (1) lower climate sensitivity, but also (2) weaker anthropogenic forcing, and it is the combination of the two that determines the outcome.
Author

Roy W. Spencer received his Ph.D. in meteorology at the University of Wisconsin-Madison in 1981. Before becoming a Principal Research Scientist at the University of Alabama in Huntsville in 2001, he was a Senior Scientist for Climate Studies at NASA’s Marshall Space Flight Center, where he and Dr. John Christy received NASA’s Exceptional Scientific Achievement Medal for their global temperature monitoring work with satellites. Dr. Spencer’s work with NASA continues as the U.S. Science Team leader for the Advanced Microwave Scanning Radiometer flying on NASA’s Aqua satellite. He has provided congressional testimony several times on the subject of global warming.
Dr. Spencer’s research has been entirely supported by U.S. government agencies: NASA, NOAA, and DOE. He has never been asked by any oil company to perform any kind of service. Not even Exxon-Mobil.
Dr. Spencer’s first popular book on global warming, Climate Confusion (Encounter Books), is now available at Amazon.com and BarnesAndNoble.com.

more news

Debate Challenge issued by Friends of Science to eponymous UN Group
As the Friends of Science Society celebrates its 24ᵗʰ year of operation, they issue a debate challenge on climate and Net Zero targets, to the upstart UN “Friends of Science” group, described in this report by Inside Climate News on the Bonn Climate Conference.
Filling German gas storage facilities before the heating season is going to be difficult
Will Germany's gas storage facilities be sufficient for the coming winter? In his latest newsletter, Dr. Fritz Vahrenholt analyzes the unusually low storage levels and explains why political decisions could increasingly jeopardize Germany's gas supply.

Trump Admin Hires Sceptic Matthew Wielicki to Run National Climate Assessment
The U.S. Global Change Research Program has a new boss: Dr. Matthew Wielicki. He is a former University of Alabama geochemist, a self-described professor in exile, who spends a fair amount of time questioning mainstream climate science online. He will now oversee the program’s flagship product, the congressionally mandated National Climate Assessment.

