Solar Activity: Cycle 25 Surpasses Cycle 24
By Javier Vinós reposted from Andy May Petrophysicist
Over the past two decades, solar activity has been characterized by an extended solar minimum spanning two solar cycles, known as the Clilverd Minimum. This phenomenon is currently affecting the climate, but before we can understand its impact, we must address the significant discrepancy between the solar effects observed in paleoclimate proxy records and modern observations. The relationship between solar signals and climate response is complex and not fully understood. However, there is substantial evidence from models and reanalyses that the relationship exists. A recent hypothesis is that the solar signal modulates heat and moisture transport to the Arctic, which explains its relatively small effect during a single solar cycle. However, when an anomaly in solar activity persists over several cycles, as it did during the 70-year modern solar maximum, its effect accumulates and has a large impact on the planet’s energy budget. Understanding this mechanism is critical to understanding the overall impact of solar activity on our climate.

Clintel Foundation
Date: 6 July 2023
Current Solar Activity
The monthly sunspot number for June 2023 reached 163.4. While this figure may be revised slightly, it’s likely to stand as the highest number seen in over two decades, since September 2002. Solar Cycle 25 is relatively young, only three and a half years old, which means there are ample opportunities over the next three years to surpass this month’s 20-year record. Based on recent data, it seems very likely that Solar Cycle 25 will surpass Solar Cycle 24 in terms of activity.
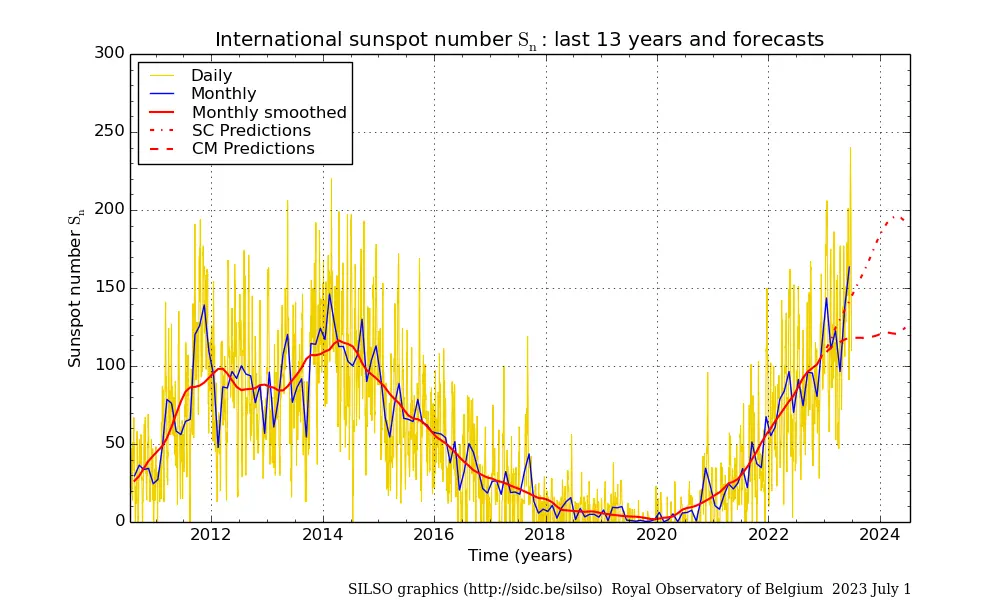
Figure 1. Daily and monthly sunspot numbers over the past 13 years, as provided by SILSO.
Both solar cycles 24 and 25 show significantly low activity compared to the average of the last 300 years. Together they represent an extended solar minimum, recently proposed to be named the Clilverd Minimum.[1] This name derives from a paper published in 2006 by Mark Clilverd and colleagues, in which they successfully predicted the occurrence of this event.[2]
Contrary to earlier predictions, the likelihood of a solar grand minimum in the 21st century is becoming increasingly remote. Similarly, predictions that the current extended solar minimum would lead to a marked decrease in temperature are incorrect. However, this doesn’t mean that the Clilverd minimum has no effect at all. Changes in solar activity indirectly affect surface temperatures in a complex way. Understanding how these solar variations affect the climate is crucial to identifying their effects.
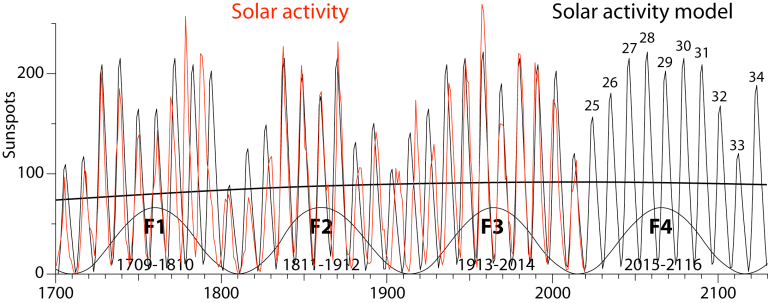
Figure 2. Projected solar activity based on my 2018 model, which relies on long-period solar cycles. The model uses the total number of sunspots in a cycle, rather than peak activity, and assumes regular 11-year cycles. At each point, it estimates the effect of five different long cycles, considering their historical impact on sunspots or 14C records. Four Feynman (100-year) solar cycle periods are indicated at the bottom.
The solar effect on climate (I). Modern observations
There exists a great discrepancy between the solar effects observed in paleoclimatic proxy records and modern observations. According to satellite instruments, the change observed over the solar cycle amounts to a mere 1.1 W m–2, and the variability observed over the past 9,000 years doesn’t appear to be much higher, approximately 1.5 W m–2.[3] This presents another challenge because the change is so minuscule that its impact should be indiscernible amidst the noise of climate data. However, numerous studies consistently identify a climate influence of approximately 0.1°C attributed to the solar cycle, which is about four times larger than expected from the slight radiative change. Consequently, there arises a necessity for an amplifying mechanism to account for this second discrepancy.
Adding to the complexity, the effect of the solar cycle on surface temperatures is not what would be expected from a marginal increase in total irradiance over the entire surface. Rather, it reveals a highly dynamic pattern characterized by certain regions experiencing warming of more than 1°C, while others show cooling trends (Figure 3). Interestingly, this pattern is like the warming observed between 1976 and 2000. During this period, the Northern Hemisphere experienced more warming than the Southern Hemisphere, land surfaces warmed more than the oceans, and the mid-latitudes of the Northern Hemisphere experienced the most pronounced warming effects.
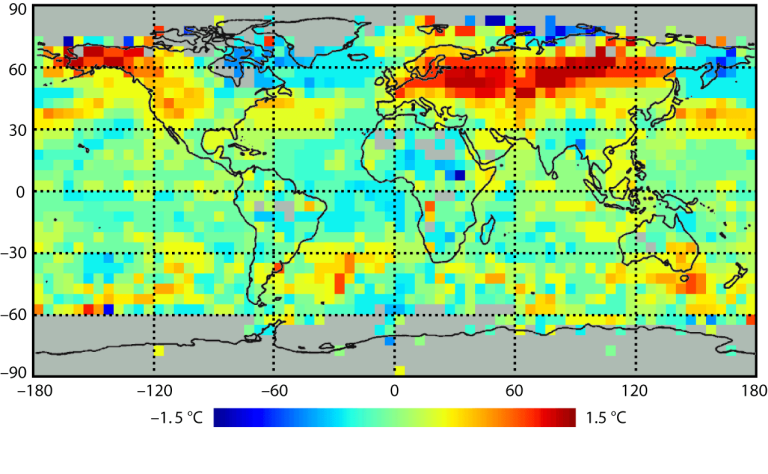
Figure 3. Regional changes in surface temperature from minimum to maximum of the 11-year cycle.[4]
This pattern is thought to result from an amplification mechanism rooted in the effects of increased solar activity on the ozone layer, leading to increased ozone levels and stratospheric temperatures. Consequently, these changes affect the speed of zonal (West/East) winds and the stability of the polar vortex. Through stratosphere-troposphere coupling, the solar signal is transmitted to the troposphere. The strength of the polar vortex plays a critical role in determining the winter state of the North Atlantic Oscillation, which becomes markedly positive during periods of high solar activity. In addition, the position of the jet stream is influenced by the strength of the vortex, causing it to shift poleward and become more circular (as opposed to meandering, see Figure 4) during these periods of high solar activity. As a result of this movement, cold Arctic air masses are trapped in the Arctic region, leading to warmer winters in the mid-latitudes of the Northern Hemisphere.
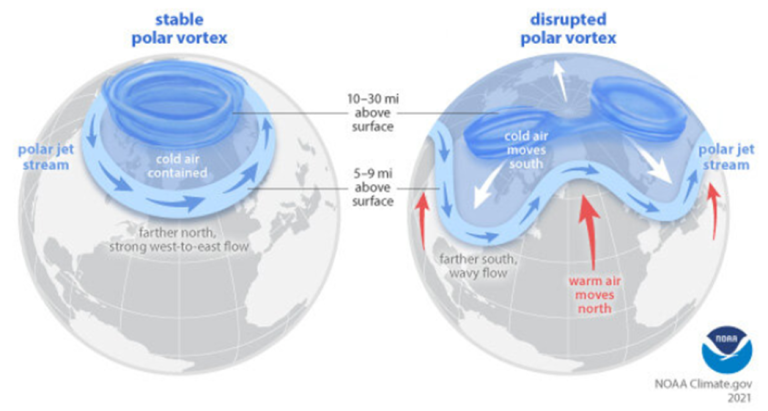
Figure 4. A stable polar vortex, with a cold Arctic and warm continents is shown on the left, and a weak polar vortex with a warm Arctic and cold continents is shown on the right. The left configuration is more common during high solar activity and the right is more common during solar lows.[5]
In tropical regions, changes in atmospheric circulation occur due to the poleward motion of the jet stream and a reduction in the upward branch of the Brewer-Dobson circulation. As a result, the Hadley circulation expands, leading to a corresponding shift in the subtropical jet. These changes significantly affect precipitation patterns and contribute to mid-latitude warming, as less heat is transported to the Arctic due to a strengthened polar vortex.
Both data assimilation reanalysis products and climate models that incorporate ozone chemistry and stratospheric circulation can reproduce these effects in response to prescribed changes in solar activity. However, they do so in a somewhat muted manner, resulting in smaller changes than observed.
Nevertheless, because solar activity rises and falls over the course of a solar cycle, the cumulative effect of its changes over several cycles is often considered insignificant.
The solar effect on climate (II). Paleoclimatic observations
As noted above, there is a stark contradiction between the relatively small climatic impact observed during an individual solar cycle and the evidence provided by paleoclimate proxy data. Remarkably, the climate patterns observed over the past 2000 years are consistent with a millennial cycle of solar activity known as the Eddy Cycle (see here, Figure 1), named after astronomer John Eddy, who revived interest in the Maunder Minimum in the 1970s. Notably, the Little Ice Age, the coldest period in the Holocene, coincided with three solar grand minimums that occurred within a span of less than 500 years.
It is important to note that the onset of the Little Ice Age cannot be attributed to changes in greenhouse gas levels, as CO2 levels remained constant between 1100 and 1500 AD. In addition, the Little Ice Age cannot be explained by volcanic eruptions alone, as no significant volcanic events were recorded for an extended period of three hundred years, from 1458 to 1765.
The evidence linking solar activity to major climate changes strongly suggests that the Eddy Cycle has played a major role in shaping the climate of the past 2000 years. This is illustrated in Figure 5, which shows the 14C record – a proxy for solar activity – with its 1000-year bandpass frequency sinusoid. In addition, the figure shows a climate proxy: the measurement of petrological tracers in benthic cores that reflect the amount of iceberg discharge in the North Atlantic.[6] These tracers are carried by icebergs and released as they melt. During colder periods with increased winter snowfall, coastal glaciers advance and release more icebergs, resulting in a higher amount of tracer.
While the two curves may not be perfectly aligned, their overall correlation is too compelling to dismiss as mere coincidence. Any increase in iceberg activity, indicating colder temperatures and increased snowfall, corresponds to a decrease in solar activity. Consequently, this observed relationship implies that solar activity has served as the primary driver of climate on a centennial time scale over the past 2000 years.
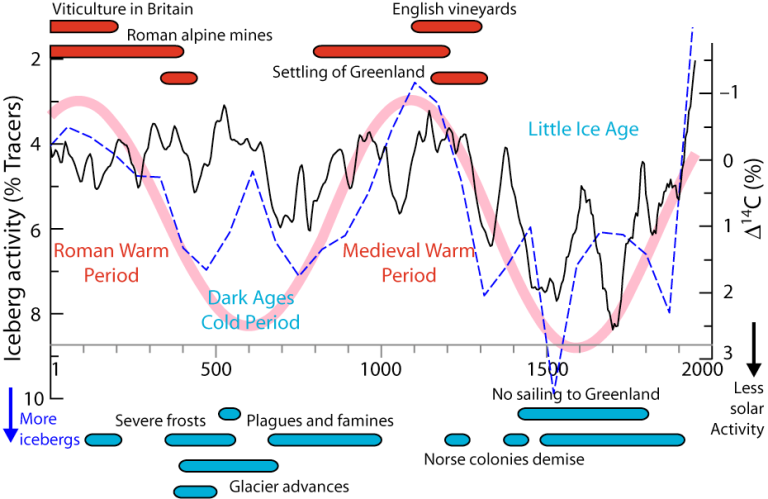
Figure 5. The millennial solar-climate cycle over the past 2000 years. The anomaly in 14C production levels (black curve), a proxy for solar activity, is compared to iceberg activity in the North Atlantic (dashed blue curve), a climate proxy. The pink sine curve shows the millennial frequency. It defines two warm and two cold periods, supported by a large amount of evidence, some of which are represented by red and blue bars (see main text).
The climate of the past two millennia can be divided into four distinct phases:
- The Roman Warm Period (ending around 400 AD)
- The Dark Ages Cold Period, which consists of two parts — an early part around 500 AD and a late one around 700 AD
- The Medieval Warm Period (centered around 1100 AD)
- The Little Ice Age (beginning around 1300 AD)
This scheme, marked by its millennial quasi-periodicity, finds strong support from an abundance of historical, biological, geological, and climatic evidence. A recent publication presents some of this compelling evidence in the form of colored bars (Figure 5), where warm indicators are represented by red bars and cold indicators by blue bars.[7]
The problem can be summarized as follows: If we do not acknowledge the substantial effect of low solar activity, we are left without a satisfactory explanation for the occurrence of the Little Ice Age. The application of causal identification techniques within systems theory sheds light on this problem of explainability.[8] These techniques involve comparing forced identification, using the forcings identified by the IPCC, with free identification, where no specific forcings are assumed. This analysis shows that a large solar forcing is needed to explain both the Medieval Warm Period and the Little Ice Age. As a result, the IPCC hypothesis of low climate sensitivity to solar activity is shown to be incorrect.
Resolving the discrepancy about the solar effect on climate
Ignoring evidence that contradicts a hypothesis is never a good idea in science. The IPCC reports rely on paleoclimate proxy evidence to assert that ongoing climate change is highly unusual and that current temperatures are most likely the highest they have been in a long time. However, when it comes to examining the paleoclimatic consequences of past variations in solar activity, the IPCC reports find the proxy evidence inconclusive.
In fact, the evidence is abundant and consistent, clearly indicating that the solar effect on climate does not result from small variations in total solar irradiance at the surface. On the contrary, solar changes primarily affect atmospheric circulation and, in turn, the intensity of heat and moisture transport to the Arctic, especially during the winter season when atmospheric circulation is enhanced.
During winter, the Arctic has a weak greenhouse effect because its atmosphere contains minimal water vapor – a critical component responsible for 75% of the greenhouse effect along with cloud formation. Consequently, the polar regions act as cooling systems within the thermodynamic heat engine of the climate. Changing the amount of heat transported to the Arctic during winter has a noticeable impact on the planet’s energy balance. Although the impact may seem small in a single year, it quickly accumulates to a large effect when changes in solar activity persist over several decades, as was the case during the Modern Solar Maximum for most of the 20th century.
This hypothesis not only reconciles paleoclimate and modern evidence, but it also has great explanatory power, i.e., it explains a greater number of facts, sheds light on puzzling observations, relies less on authority and more on empirical observations, makes a minimum of assumptions, and is more easily falsifiable. This makes it a better hypothesis than the one based on the enhanced effect of CO2 changes.
An academic book has recently been published by this author presenting the new hypothesis.[9] It has also been further explored in several blog posts on this site. In addition, a forthcoming book aimed at a broader audience will provide a compelling evidence-based explanation of the influence of changes in heat transport on recent climate changes.
This new mechanism does not contradict existing theories, such as the effects of increased human emissions, but it significantly reduces their potential impact. Paleoclimatic evidence strongly suggests that this mechanism serves as the primary driver of climate change on centennial to millennial time scales. As a result, the existence of a climate crisis and the potential positive climatic effects of drastically reducing our emissions must be seriously questioned.
- Vinós, J., 2022. Climate of the Past, Present and Future: A scientific debate. 2nd ed. Critical Science Press. amazon.com/dp/B0BCF5BLQ5/ ↑
- Clilverd, M.A., et al., 2006. Space Weather, 4 (9). doi.org/10.1029/2005SW000207 ↑
- Gulev, S.K., et al., 2021. Climate change 2021: The physical science basis. 6th AR IPCC. p.297. doi.org/10.1017/9781009157896.004 ↑
- Lean, J.L., 2017. Sun-climate connections. In: Oxford Research Encyclopedia of Climate Science. doi.org/10.1093/acrefore/9780190228620.013.9 ↑
- Understanding the Arctic polar vortex | NOAA Climate.gov ↑
- Bond, G., et al., 2001. Science, 294 (5549), pp.2130–2136. doi.org/10.1126/science.1065680 ↑
- Moffa-Sánchez, P. & Hall, I.R., 2017. Nat. Commun. 8 (1), p.1726. doi.org/10.1038/s41467-017-01884-8 ↑
- de Larminat, P., 2016. Annu. Rev. Control, 42, pp.114–125. doi.org/10.1016/j.arcontrol.2016.09.018 ↑
- Vinós, J., 2022. Climate of the Past, Present and Future: A scientific debate. 2nd ed. Critical Science Press. amazon.com/dp/B0BCF5BLQ5/ ↑


more news

Climate realism is gaining ground in Denmark
The leading Danish business newspaper, Børsen, recently featured both climate alarmism and a response to it from climate realist Karl Iver Dahl-Madsen. According to him, this is a cause for cautious optimism.

Debate Challenge issued by Friends of Science to eponymous UN Group
As the Friends of Science Society celebrates its 24ᵗʰ year of operation, they issue a debate challenge on climate and Net Zero targets, to the upstart UN “Friends of Science” group, described in this report by Inside Climate News on the Bonn Climate Conference.

Filling German gas storage facilities before the heating season is going to be difficult
Will Germany's gas storage facilities be sufficient for the coming winter? In his latest newsletter, Dr. Fritz Vahrenholt analyzes the unusually low storage levels and explains why political decisions could increasingly jeopardize Germany's gas supply.

