The new IPCC report, abbreviated “AR6,” is due to come out between April 2021 (the Physical Science Basis) and June of 2022 (the Synthesis Report). I’ve purchased some very strong hip waders to prepare for the events. For those who don’t already know, sturdy hip waders are required when wading into sewage. I’ve also taken a quick look at the CMIP6 model output that has been posted to the KNMI Climate Explorer to date. I thought I’d share some of what I found.
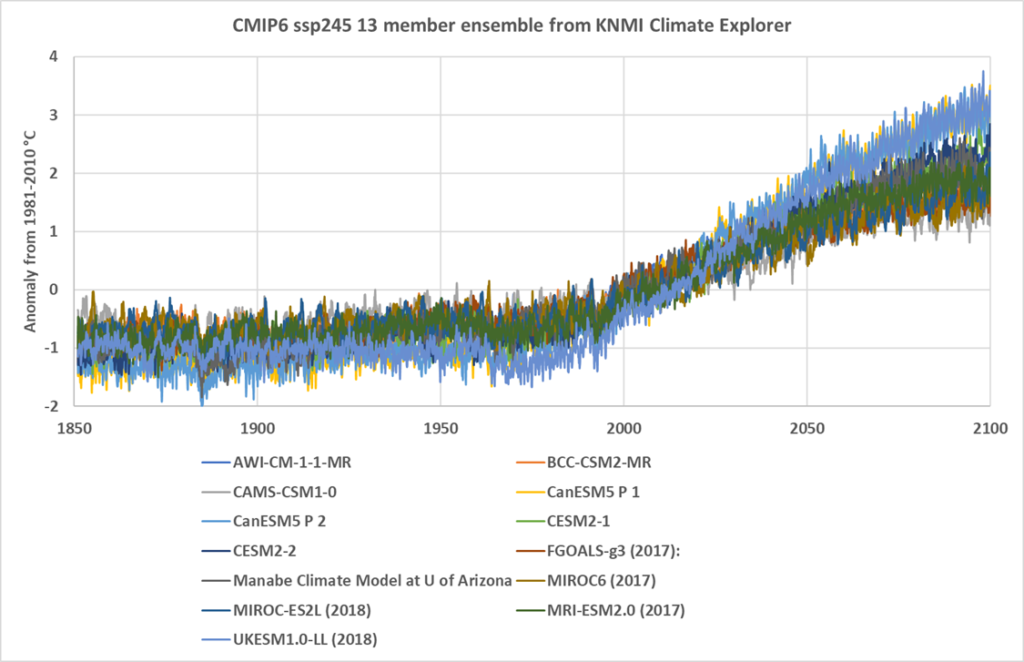
Figure 1. The CMIP6 13-member model ensemble from the KNMI Climate Explorer. The global temperature anomaly from the 1981-2010 average is plotted for all model runs. All 13 model runs are plotted from the ensemble. Notice there are two runs plotted for three of the models.
There are two model ensembles on the website currently, one contains 68 model runs and the other contains 13. Figure 1 shows all 13 runs for the smaller ensemble. There are two runs in the ensemble from the Canadian Centre for Climate Modeling (CanESM5 P1 and P2). There are also two for NCAR (CESM2-1 and CESM2-2) and two for the Jamstec model (MIROC). So, Figure 1 represents ten models total. The models use historical forcing before 2014 and projected forcing after.
All curves are global average temperature anomalies from the 1981-2010 average temperature. Notice the 19th century spread of results is over one degree C. The current spread of results is not much tighter and the spread at 2100 is over two degrees. All these model runs use the ssp245 emissions scenario, which is the CMIP6 version of RCP 4.5, as far as I can tell. Thus, it is the middle scenario.
Two of the runs are pretty wild, the pale blue model that is very low in 1960 and very high in 2100 is the Met Office Hadley Centre model run, UKESM1.0-LL (2018). The Canadian “CanESM5 P 1” model run follows the same path but is hidden by UKESM1.0. The other runs are bunched up in a one-degree scrum.
In Figure 2 we show three of the model runs. Both Canadian model runs are shown, in blue and orange, along with one of the NCAR models in gray. The black is the 13-model run “ensemble mean” as computed by the KNMI Climate Explorer. I chose an ensemble on the website; I did not make this ensemble myself. Likewise, the ensemble mean was provided by KNMI Climate Explorer, I did not calculate it.
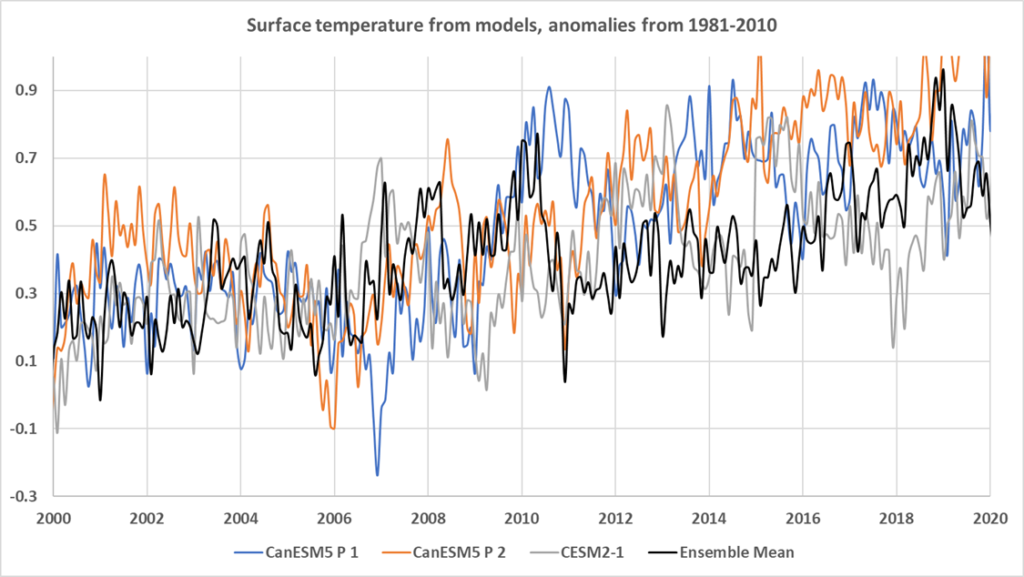
Figure 2. Three individual model runs are compared to the 13-member ensemble mean. The vertical axis is the anomaly from the 1981-2010 average in degrees C.
Historical forcings are used prior to 2014 and projected values after. The blue and orange curves are from two runs from a single Canadian model. The two runs are over 0.2°C different in 2010 and 2011, some months they are over 0.5°C different. There are multiple periods where the model runs are clearly out-of-phase for several years, examples are 2001-2003 and 2014 to 2017. The period from 2015 to 2019 is a mess.
Figure 3 compares the same ensemble mean shown in Figure 2 to three weather reanalysis datasets, also downloaded from the KNMI Climate Explorer. The weather reanalysis datasets are shown in the fainter lines.
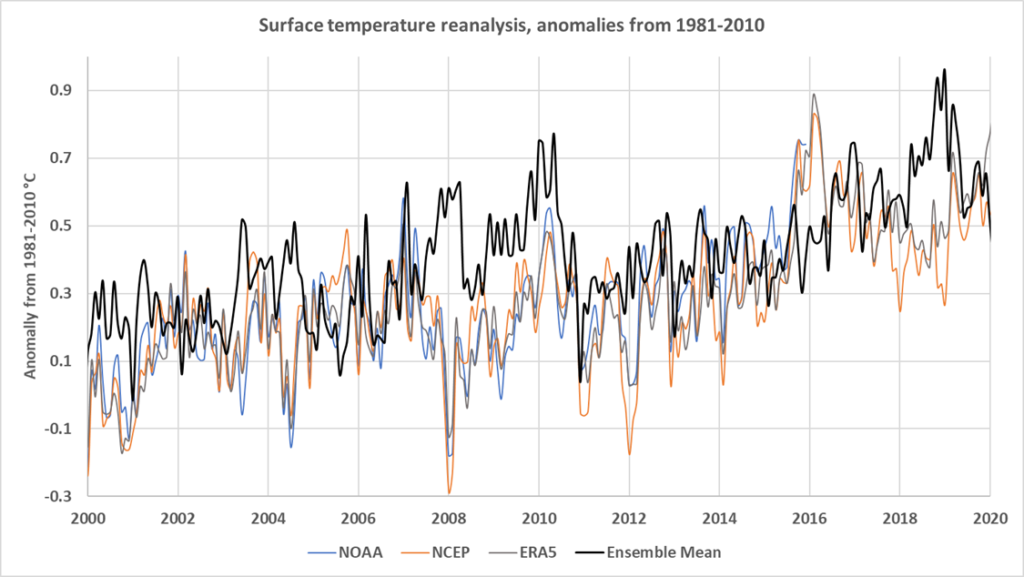
Figure 3. Three weather reanalysis data sets are compared to the model ensemble mean from Figure 2.
Weather reanalysis is done after the weather data are recorded but using a weather computer model. The reanalysis has many thousands of observations that it can incorporate, so generally the output is quite reliable, at least in my opinion. Notice all three weather reanalysis datasets, NOAA, NCEP and ERA5 (European Centre for Medium-Range Weather Forecasts) are in phase and track each other. Over periods of up to three years, the ensemble model mean is hopelessly out-of-phase with the reanalysis. This occurs when the model had historical data (before 2014) and after.
Conclusions
I’m unimpressed with the CMIP6 models. The total warming since 1900 is less than one degree, but the spread of model results in Figure 1 is never less than one degree. It is often more than that, especially in the 1960s. The models are obviously not reproducing the natural climate cycles or oscillations, like the AMO, PDO and ENSO. As can be seen in Figure 2 they often are completely out-of-phase for years, even when they are just two runs from the same model. I used the Canadian model as an example, but the two NCAR model runs (CESM2) are no better. In fact, in the 2010-2011 period and the 2015-2019 period they are worse as you can see in Figure 4.
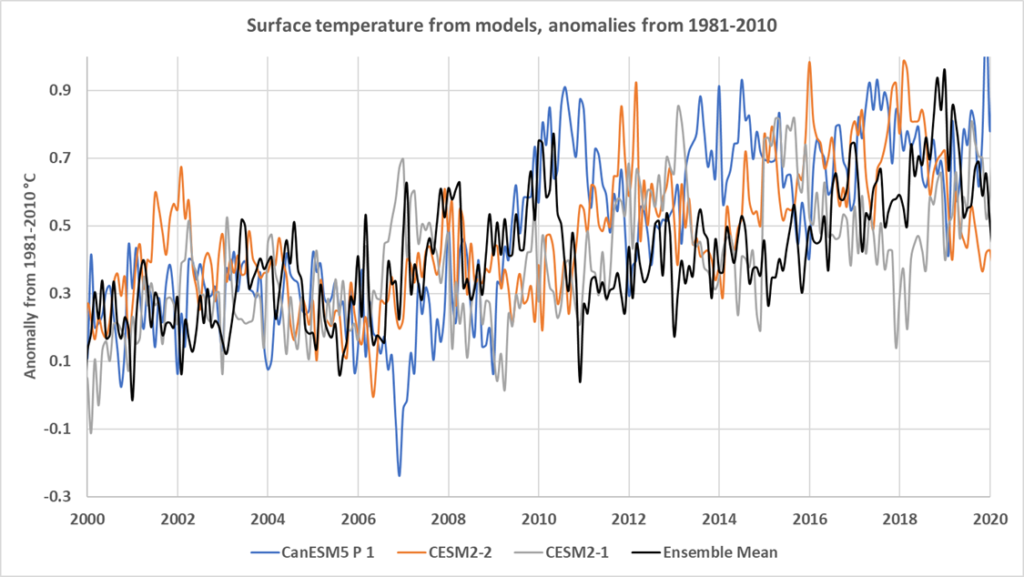
Figure 4. Comparing the two runs of the NCAR CESM2 model to the ensemble mean and a Canadian model run.
The AR5 report was an expensive redo of AR4. Both abandoned any hope of finding solid evidence of human influence on climate and tried to use climate models to show that humans somehow control the climate with our greenhouse gas emissions. They tried to use solid evidence in SAR, the second report, and TAR, the third report, but they were shown to be wrong in both attempts. You can read about their SAR humiliation here and the TAR “hockey stick” humiliation here.
Forty years of work and billions of dollars spent and still no evidence that humans control the climate. Models are all they have, and these plots do not inspire confidence in the models. As we discussed in our previous post, averaging models does not make the results better. Ensembles are no better than their member model runs and can be worse. If the individual runs are out-of-phase, as these certainly are, you destroy data, and the natural cycles, by averaging them. See the evidence presented by Wyatt and Curry and Javier, here and here. If they are going to convince this observer, they need to do much better than this. And a word to taxpayers, why are we paying these huge sums of money to simply do the same thing over and over? Bottom line, is AR6 going to be any different from AR4 or AR5? Are any of these documents worth the paper and ink?

Andy May, now retired, was a petrophysicist for 42 years. He has worked on oil, gas and CO2 fields in the USA, Argentina, Brazil, Indonesia, Thailand, China, UK North Sea, Canada, Mexico, Venezuela and Russia. He specializes in fractured reservoirs, wireline and core image interpretation and capillary pressure analysis, besides conventional log analysis. He is proficient in Terrastation, Geolog and Powerlog software. His full resume can be found on linkedin or here: AndyMay
